monitoring apps family
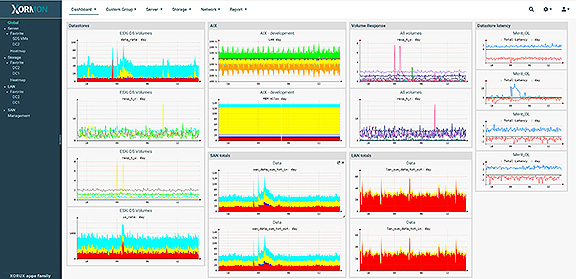
XorMon Next Generation is a full-stack infrastructure monitoring tool.
- It provides complete performance and mapping overview through Cloud, Container, Server Virtualization, Database, SAN, LAN and Storage
- Free to use. You do not need to purchase expensive commercial solutions
- Optional paid support
- Simple administration
- Enterprise edition
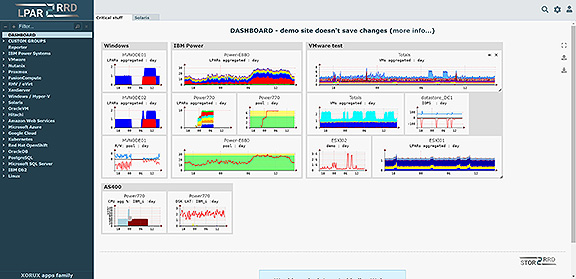
Take control and see all your physical and virtual servers from one point of view with LPAR2RRD.
- Leading performance-monitoring solution thanks to unique web-based UI for graphical interpretation of performance utilization in virtualized environment
- Free to use. You do not need to purchase expensive commercial solutions
- Optional paid support
- Simple administration
- Enterprise edition
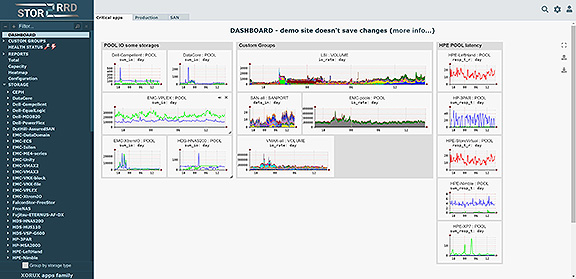
Analyze key infrastructure performance metrics of your Storage, SAN and LAN devices with STOR2RRD.
- You can find utilization of any attached storage in a simple graphical form comprehensible to anyone from technician to management level
- Free to use. You do not need to purchase expensive commercial solutions
- Optional paid support
- Simple administration
- Enterprise edition