|
Feature |
HMC |
Notes |
|||
|---|---|---|---|---|---|
| Shared processor pool | yes | ||||
| Multiple shared processor pools | yes | ||||
| Utilisation of physical adapters: SR-IOV, FC, Eth, SAS |
yes | ||||
| Live Partition Mobility support | yes | Enterprise edition feature | |||
| Active Memory Sharing (AMS) | yes | ||||
| CPU Capacity on Demand | yes | ||||
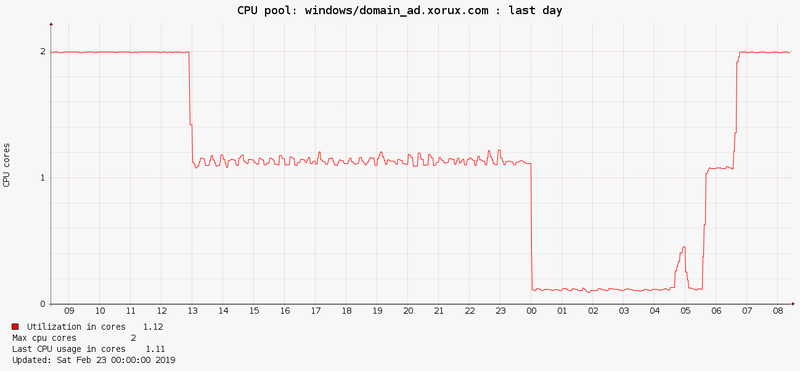
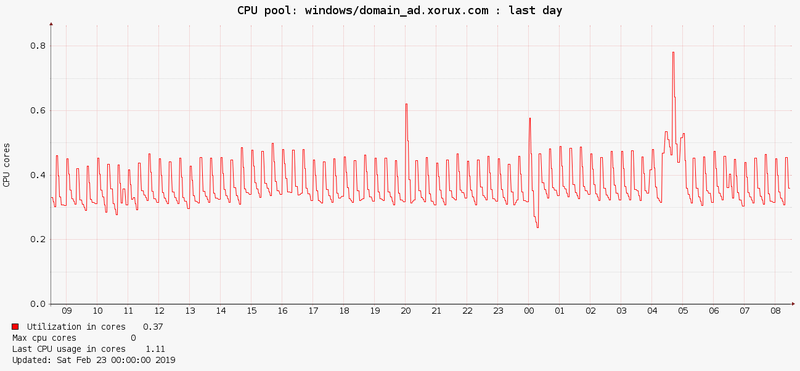
| LPAR CPU utilization aggregated | yes | per the server, CPU pool and the HMC |
|||
| Servers CPU utilization aggregated | yes | per the HMC | |||
| CPU Workload Estimator | yes | Enterprise edition with no limits | |||
| Resource Configuration Advisor | yes | yes | |||
| Historical reporting | yes | yes | Enterprise edition feature | ||
| Historical reports into CSV, pdf, xls | yes | yes | Enterprise edition feature | ||
| Custom Groups | yes | yes | Enterprise edition with no limits | ||
| Alerting | yes | yes | |||
| Trends | yes | ||||
| RMC check | yes | ||||
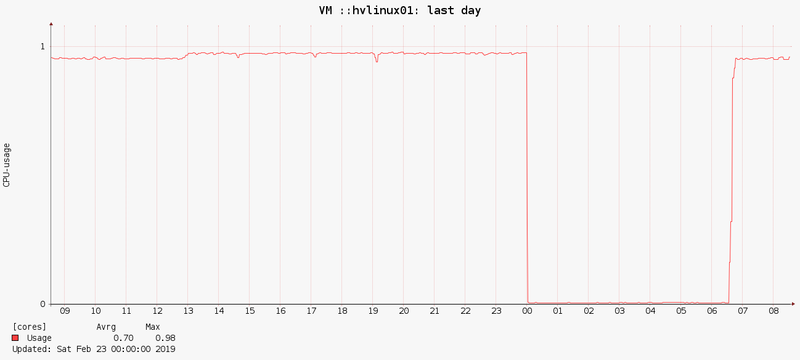
| TOP 10 LPARs per CPU utilization | yes | per a server and totally | |||
| Integrated Virtual Ethernet (IVE/HEA) | yes | per physical port | |||
| Detailed configuration | yes | physical and logical | |||
| Paging rate aggregated | yes | per a server | |||
| Memory allocation aggregated | yes | per a server | |||
| Number of LPARs and servers | yes | per the HMC | |||
| AIX VIOS Linux on POWER |
|||||
| OS CPU | yes | yes | CPU sys, user, IO wait | ||
| CPU queue | yes | ||||
| JOB | yes | CPU, Memory | |||
| Memory utilization | yes | yes | Used, FS cache, Pinned | ||
| LAN (ethernet adapters) | yes | yes | MB/sec, packet count | ||
| SAN (FC,vSCSI adapters) | yes | yes | MB/sec, IO/sec, Latency | ||
| Paging space utilization | yes | yes | Usage in % | ||
| Paging rate | yes | yes | MB/sec | ||
| Active Memory Expansion (AME) | yes | MB | |||
| Shared Ethernet Adapted (SEA) | yes | MB/sec, packet count | |||
| Filesystem usage | yes | ||||
| WLM | yes | CPU, Memory, DKIO | |||
| WPAR | yes | All OS agents metrics | |||
| vCenter | Cluster | Resource Pool |
ESXi | VM | Datastore | |
|---|---|---|---|---|---|---|
| CPU total | 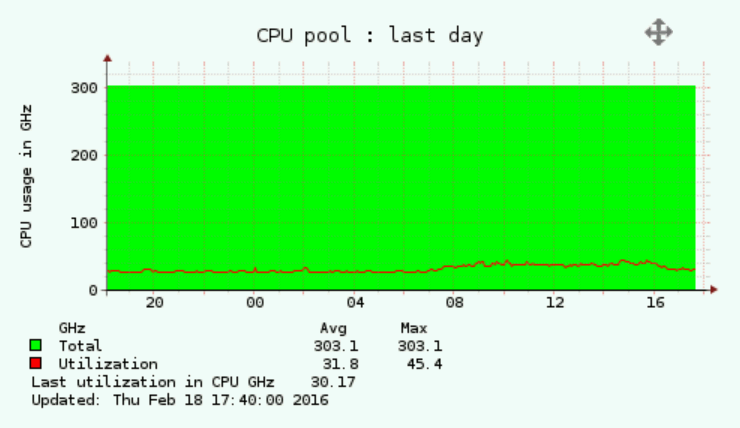 |
 |
 |
 |
||
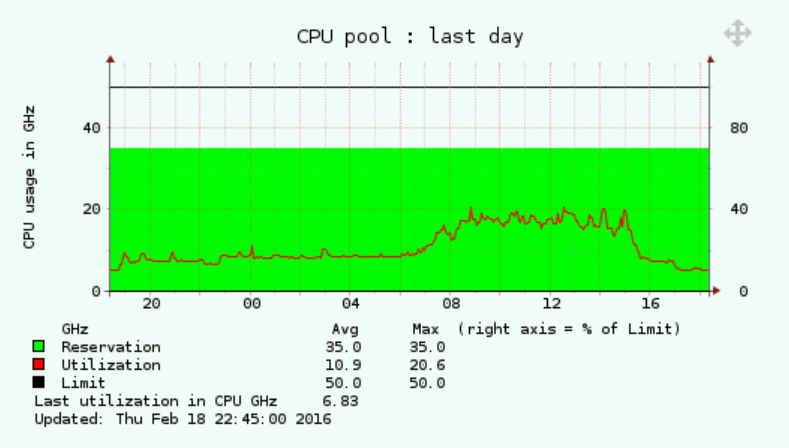
| CPU cluster aggregated | 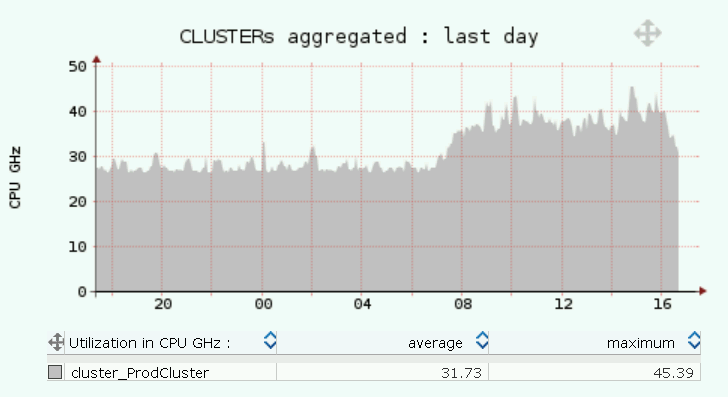 |
|||||
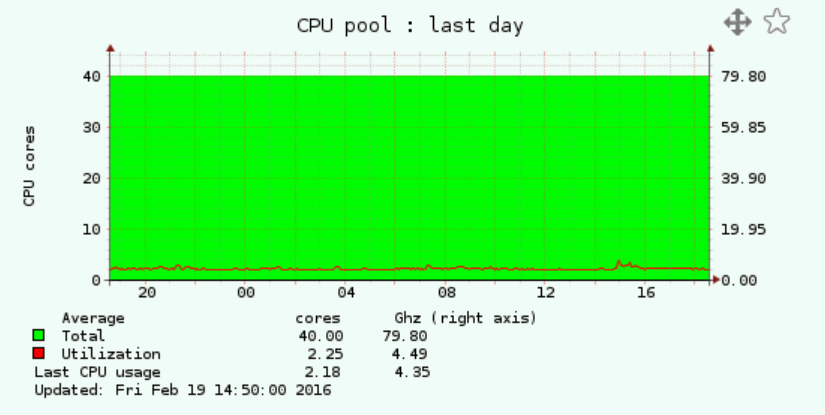
| CPU ESXi aggregated | 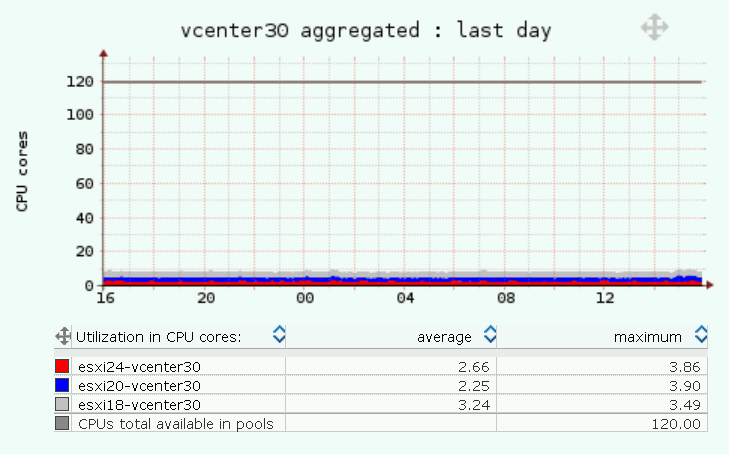 |
 |
||||
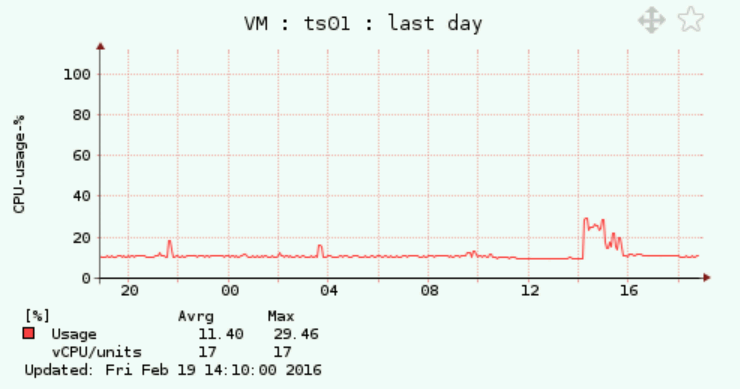
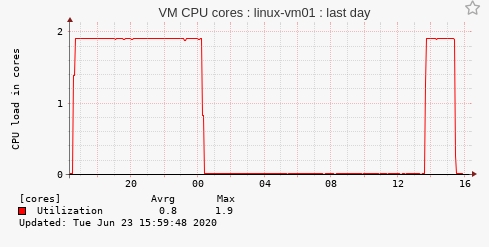
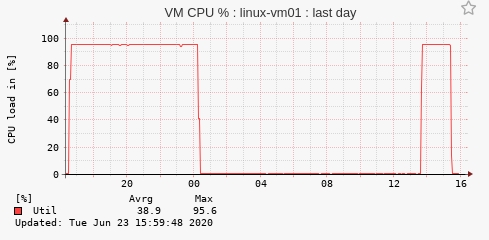
| CPU VM aggregated | 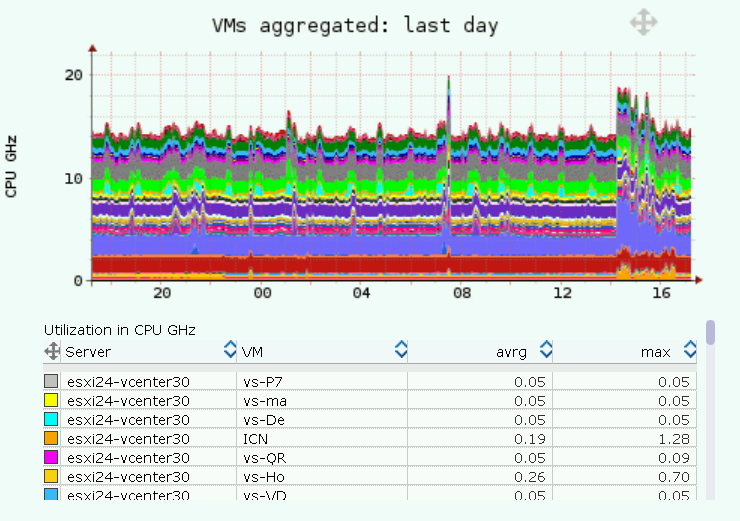 |
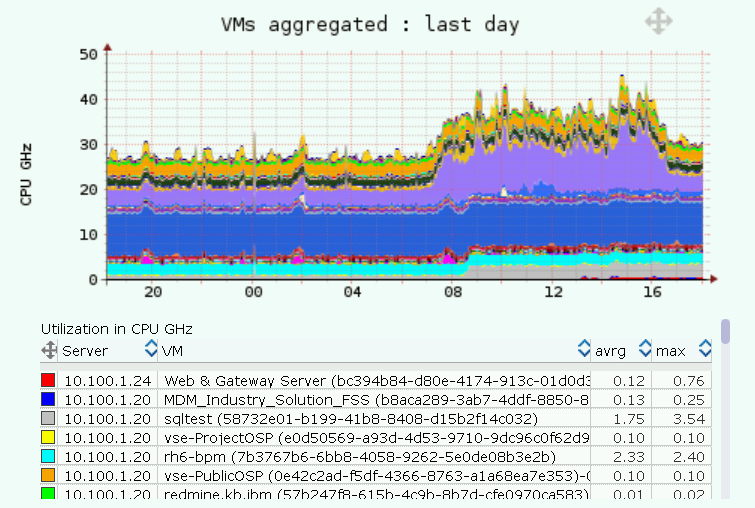 |
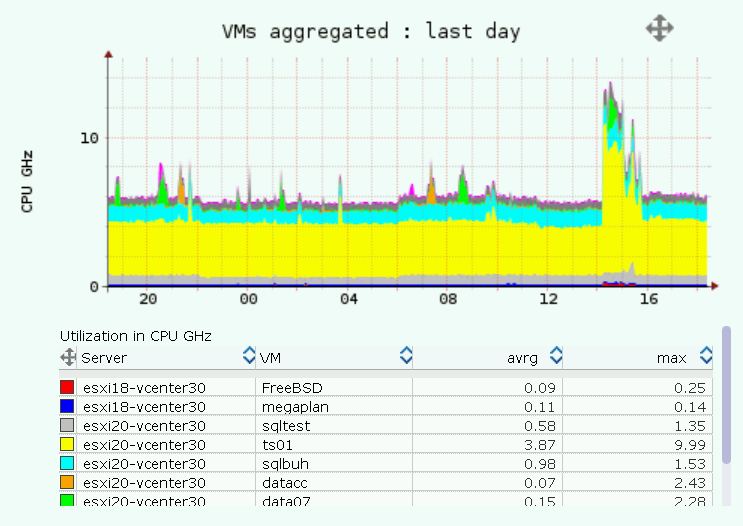 |
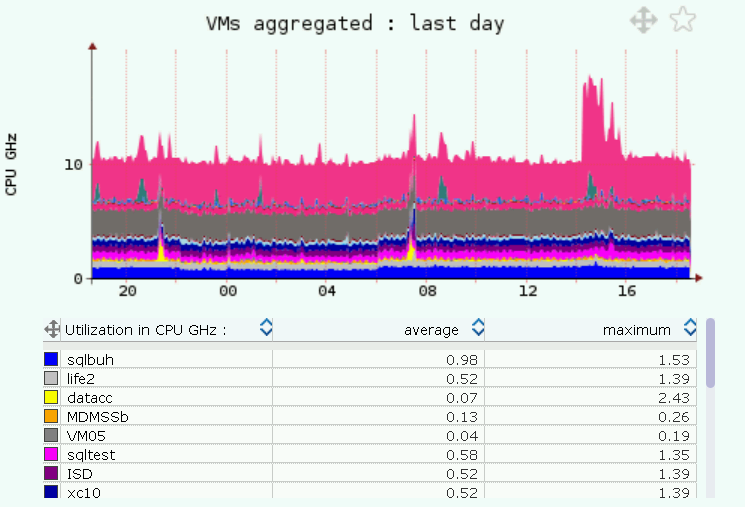 |
||
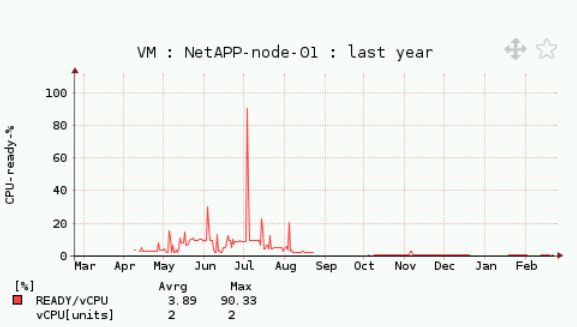
| CPU ready | 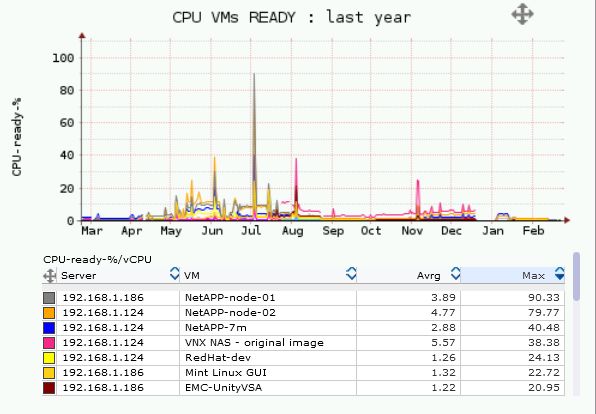 |
 |
||||
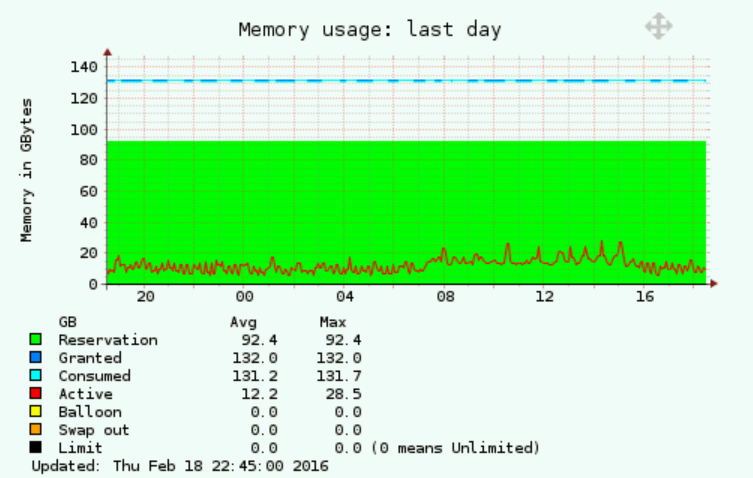
| Memory total | 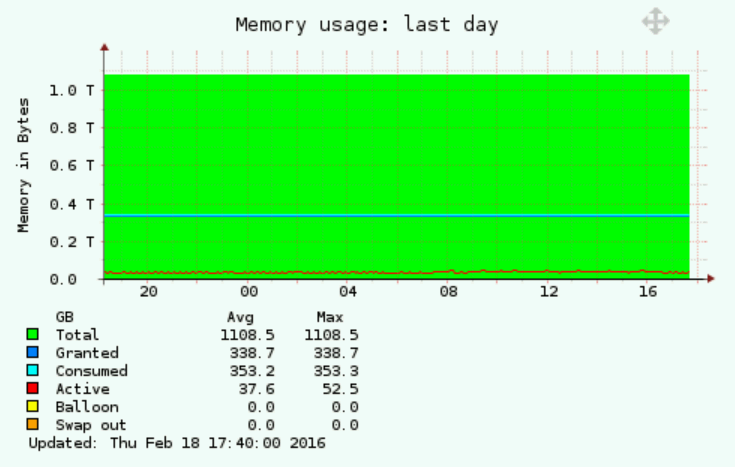 |
 |
 |
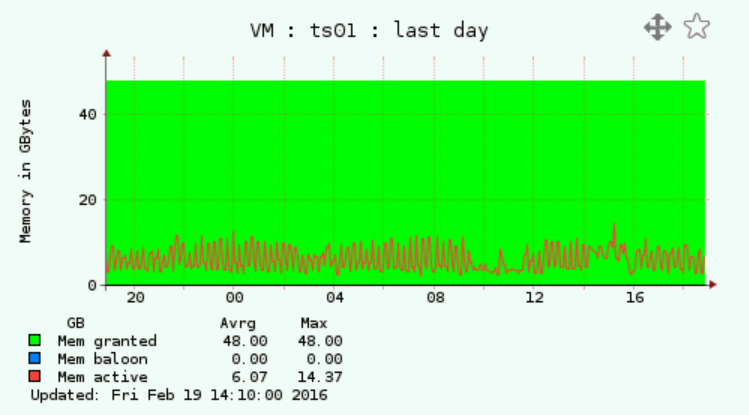 |
||
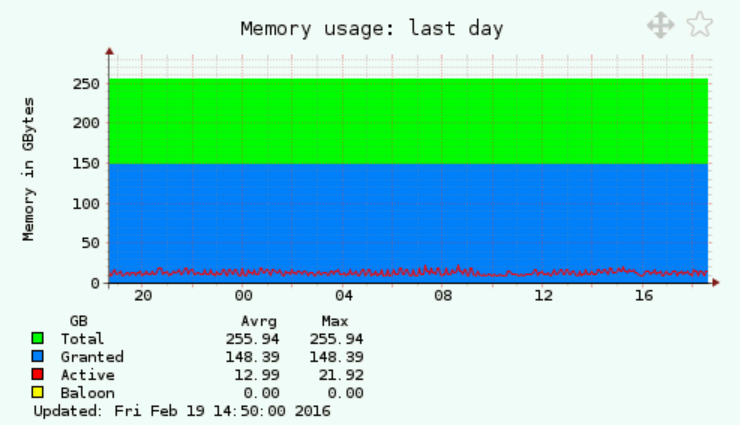
| Memory VM aggregated | 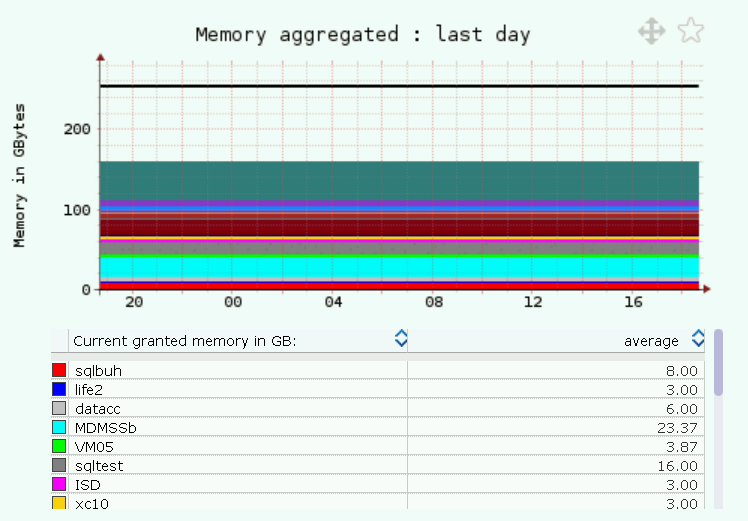 |
|||||
| Network | 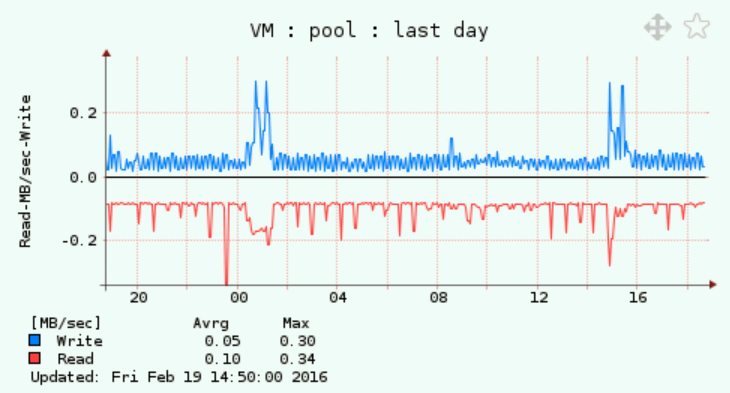 |
 |
||||
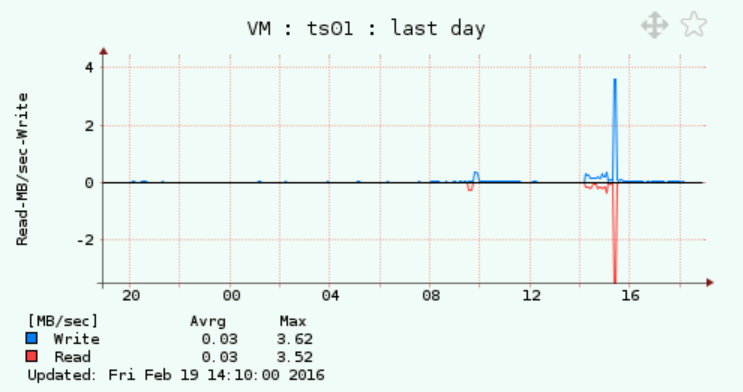
| Storage performance | 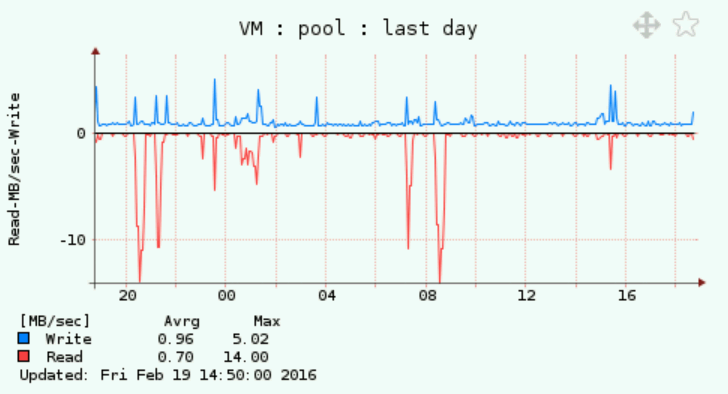 |
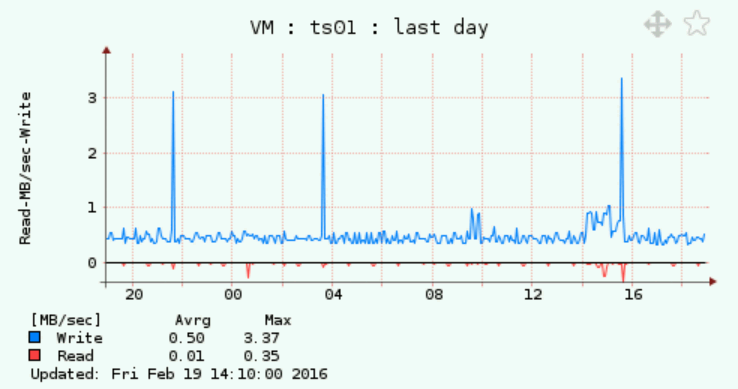 |
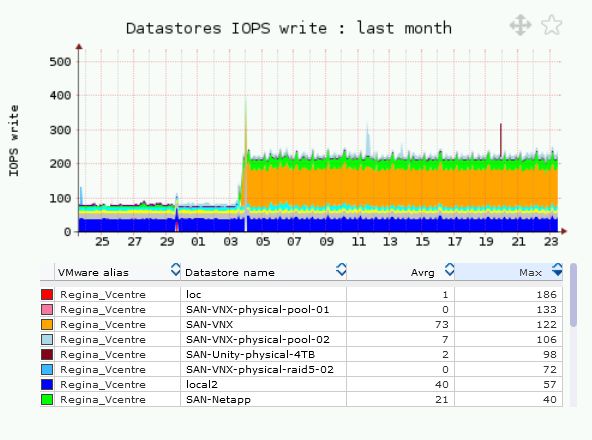 |
|||
| Storage allocation | 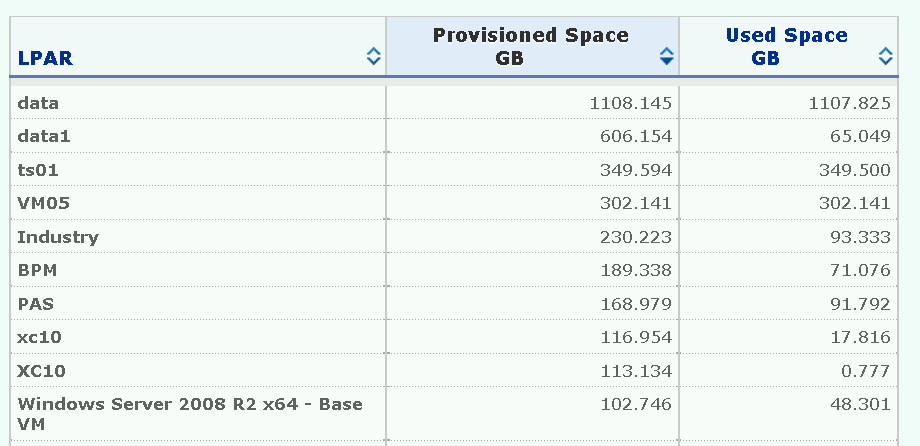 |
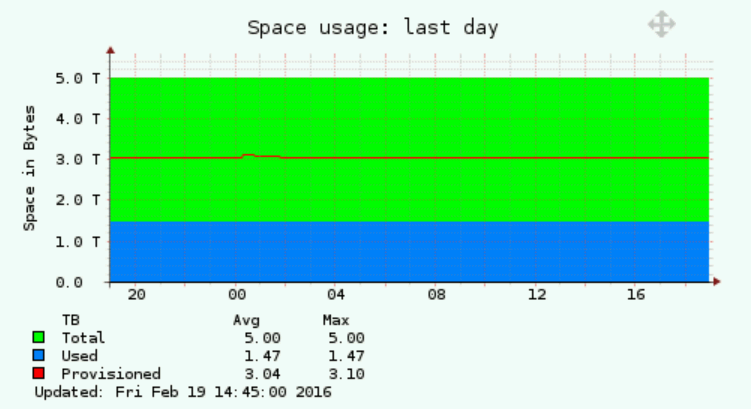 |
||||
| Power supply | 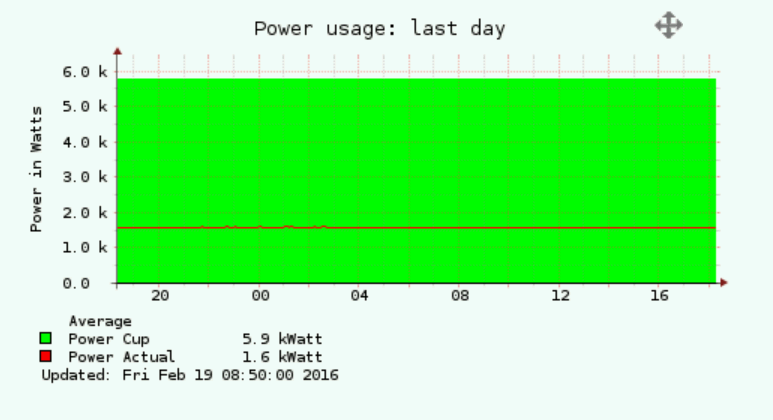 |
|||||
| vMotion | 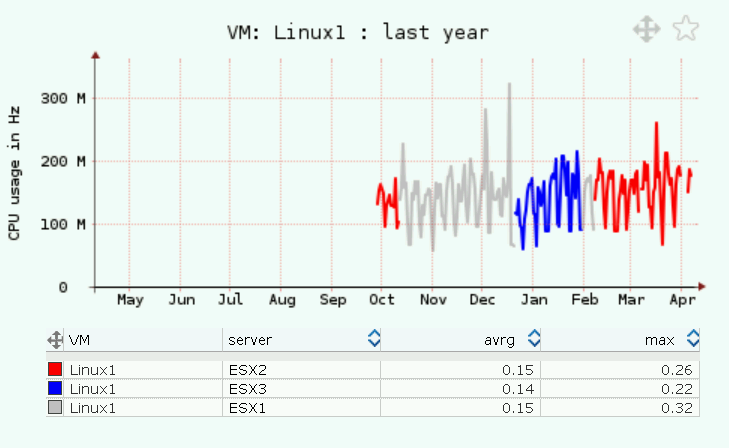 |
Monitored resources
- vCenter
- Cluster
- Resource Pool
- Datastore
- ESXi
- Virtual Machine (VM)
Monitored metrics
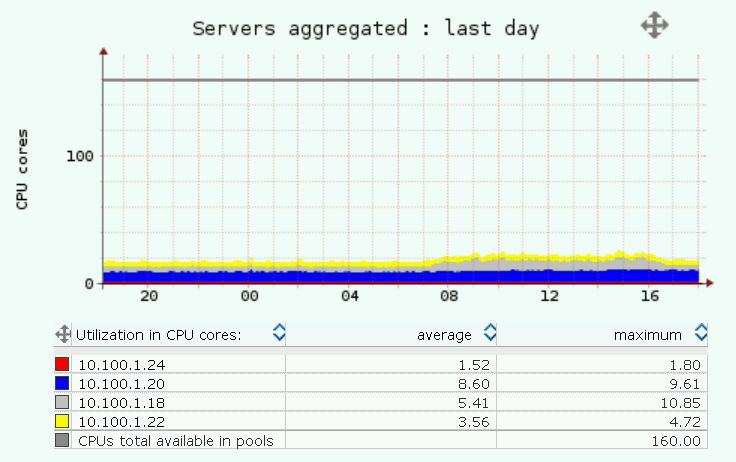
- CPU performance (GHz, CPU cores, CPU ready)
- Memory usage (reserved, granted, consumed, active, baloon, swap in, limit)
- LAN performance in (MB/sec)
- Disk performance (MB/sec, IO per sec, latency in ms)
- Disk usage (GB)
Other features
All data is retrieved agent less.
Data source is either the vCenter or ESXi itself in case it is not managed by the vCenter.
Collected data set can be enhanced about OS agent which brings these additional metrics:
| OS CPU | CPU sys, user, IO wait |
| CPU queue | Load avrg, Blocked processes |
| JOB | CPU, Memory |
| Memory utilization | Used, FS cache |
| LAN (ethernet adapters) | MB/sec, packet count |
| SAN (FC,vSCSI adapters) | MB/sec, packets/sec, Latency |
| Paging space utilization | Usage in % |
| Paging rate | MB/sec |
| Filesystem usage | Usage in %, GB |
|
Graph name |
Metric |
Per |
Per |
Per |
OS command |
Example |
|---|---|---|---|---|---|---|
| WRKACTJOB | CPU % | yes | WRKACTJOB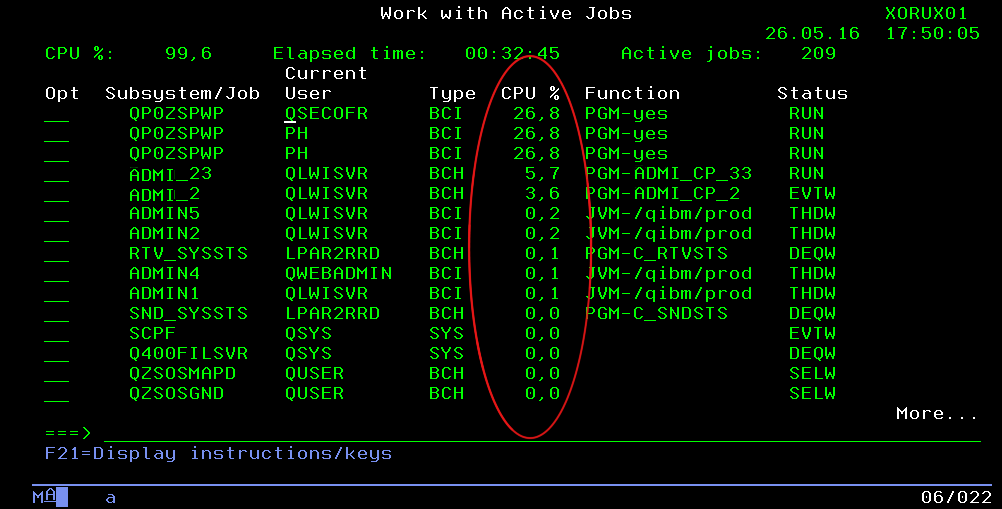 |
 |
||
| CPUTOP | CPU core | yes | 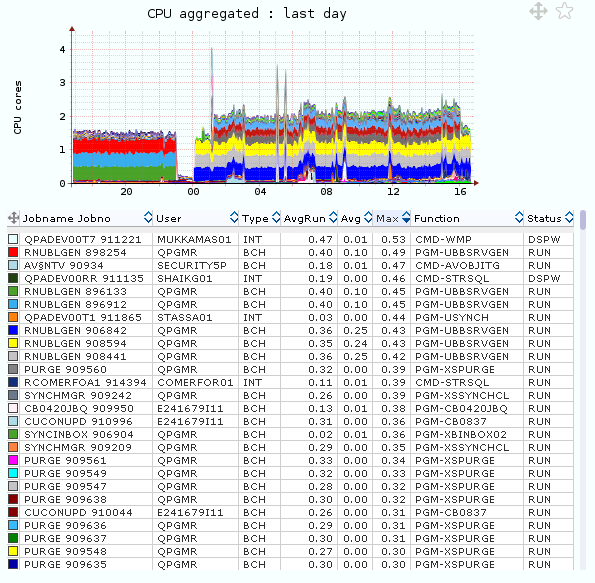 |
|||
| IOTOP | IO/sec | yes | WRKACTJOB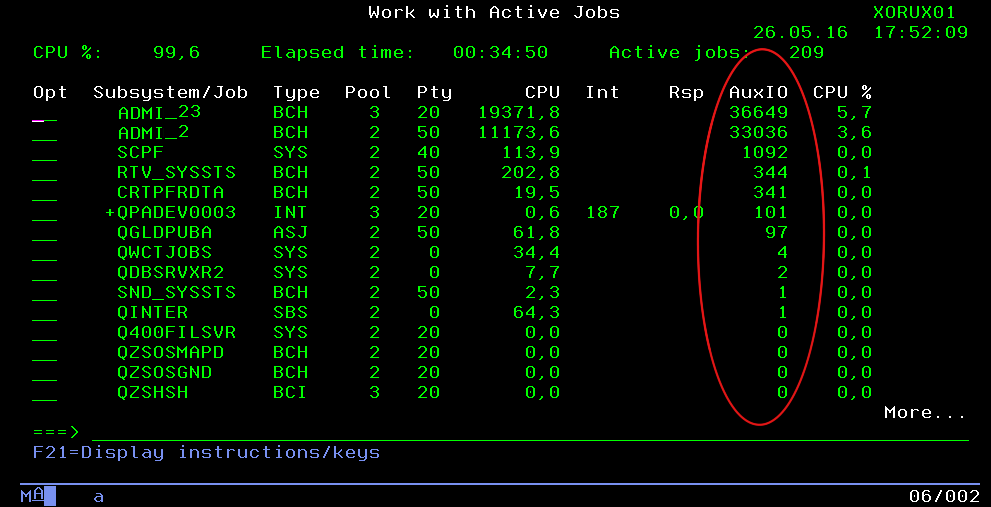 |
 |
||
| DiskTOP | ||||||
| disk busy % | yes | 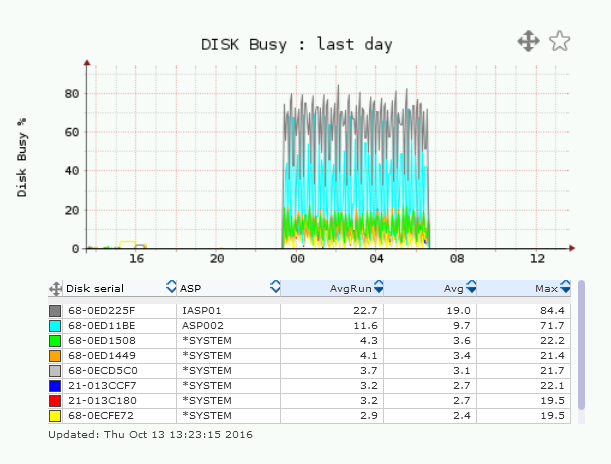 |
||||
| IO/sec | yes | 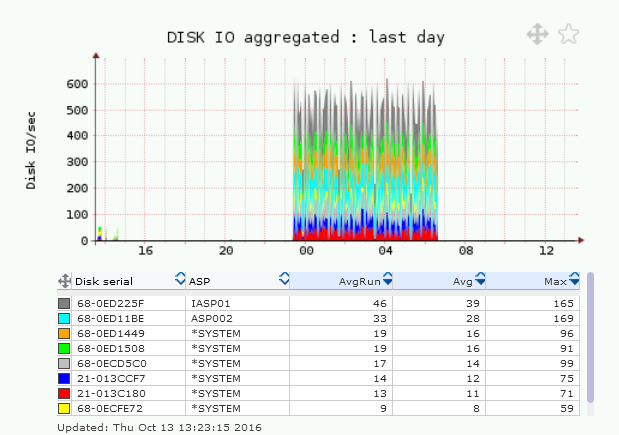 |
||||
| JOBS | ||||||
| Jobs | yes | WRKSYSSTS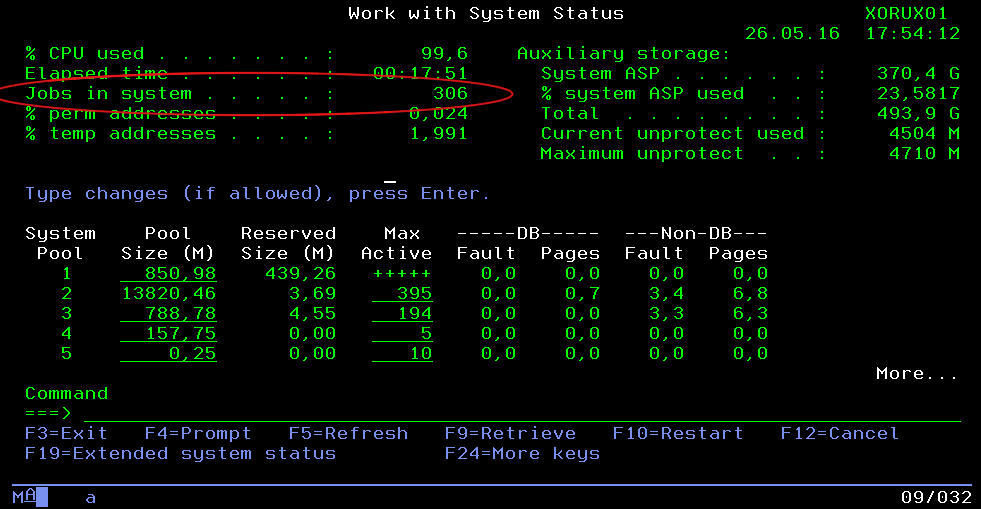 |
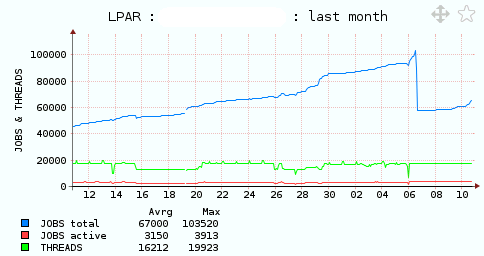 |
|||
| Active jobs | yes | |||||
| Active threads | yes | |||||
| ASP free | Free capacity | yes | DSPASPBRM | 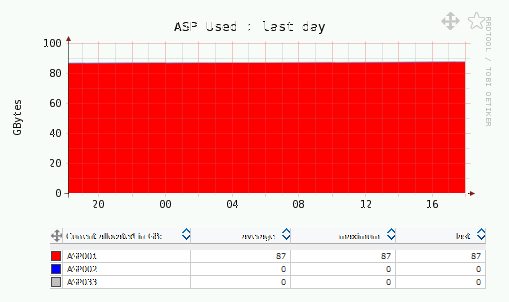 |
||
| ASP used | Used capacity | yes | DSPASPBRM |  |
||
| ASP used % | Used capacity % | yes | DSPASPBRM | |||
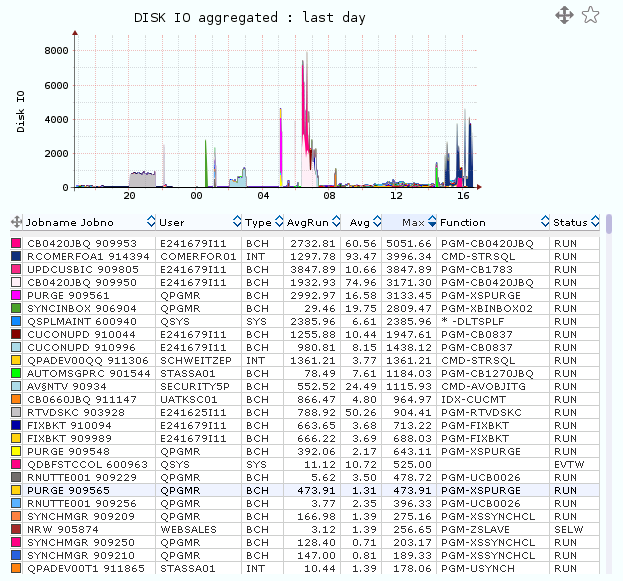
| ASP data | Data throughput | yes | WRKDSKSTS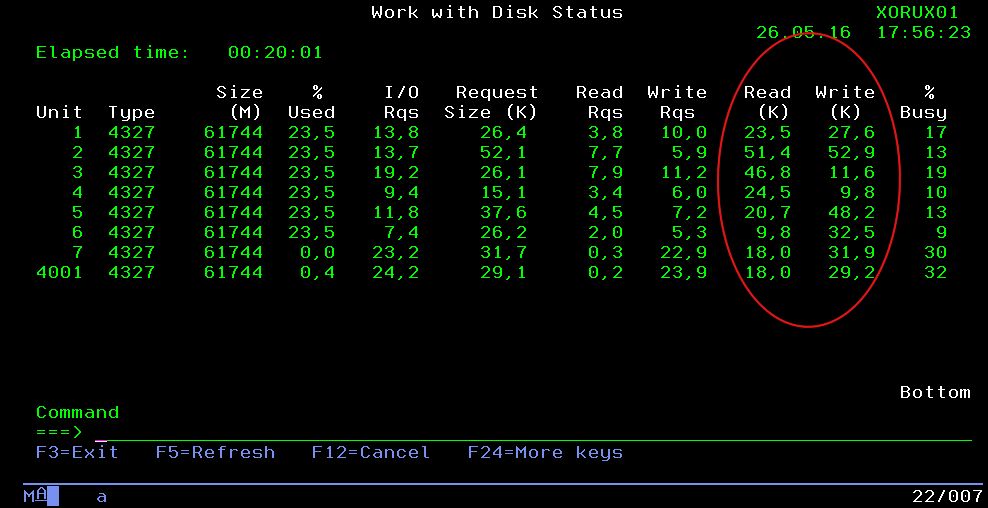 |
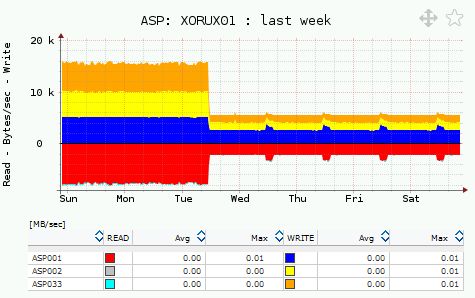 |
||
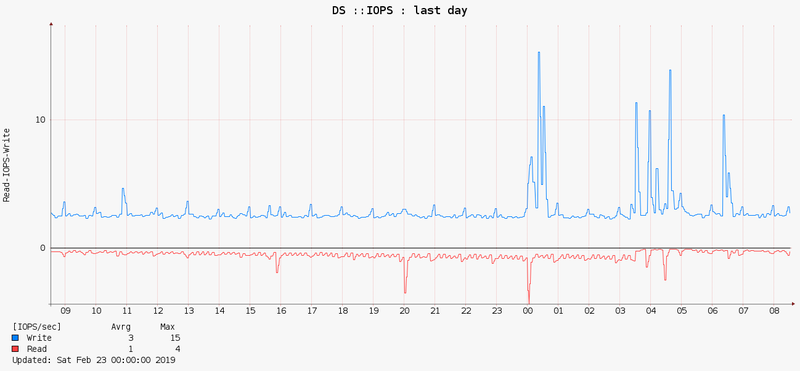
| ASP IOPS | IO/sec | yes | WRKDSKSTS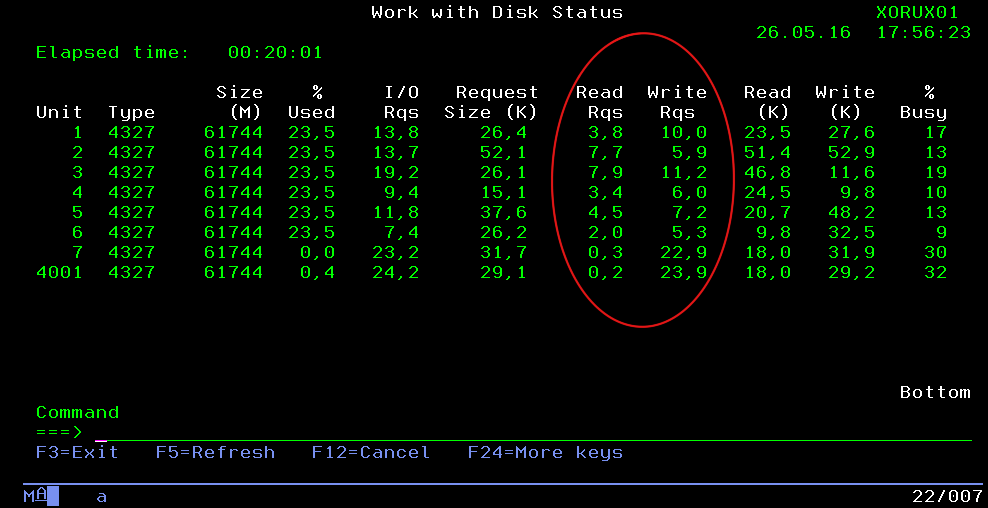 |
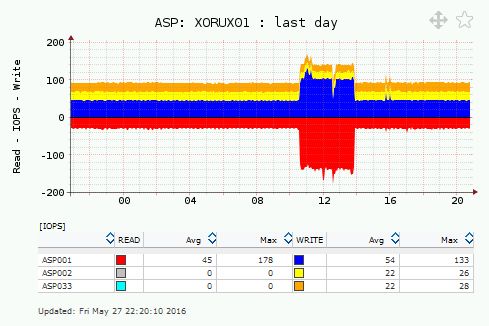 |
||
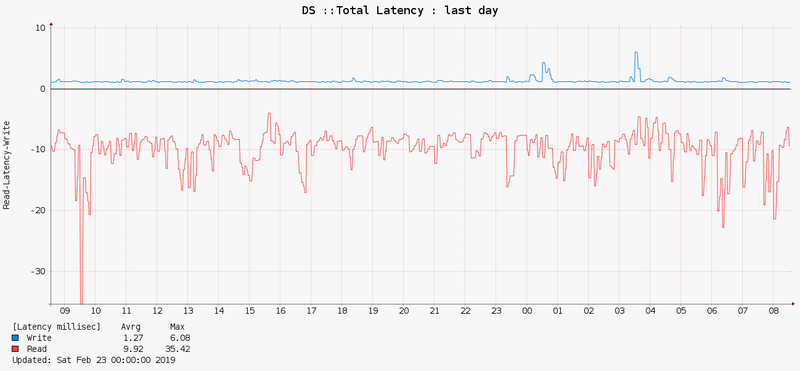
| ASP total latency | mili sec | yes | 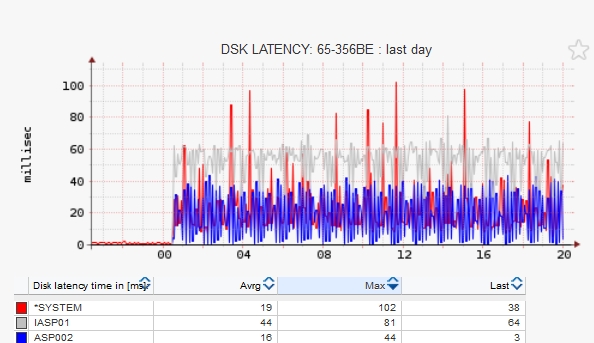 |
|||
| ASP service time | mili sec | yes | 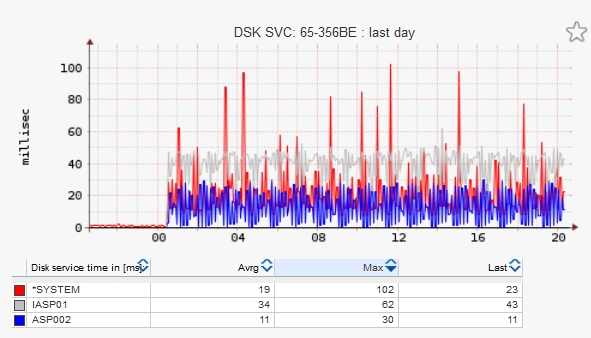 |
|||
| ASP wait time | mili sec | yes | 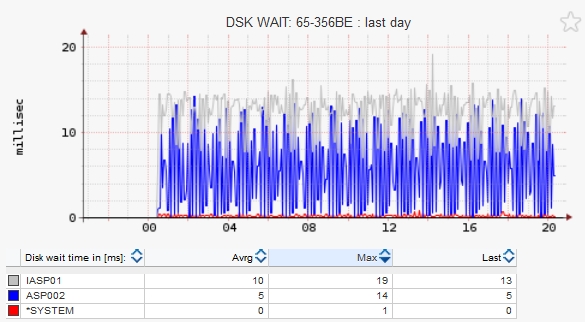 |
|||
| POOL | Pool size | yes | WRKSYSSTS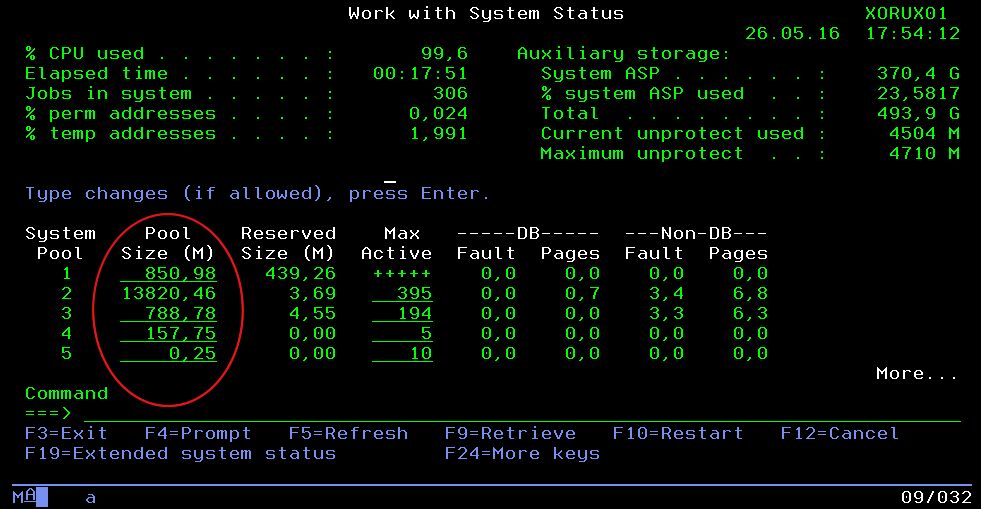 |
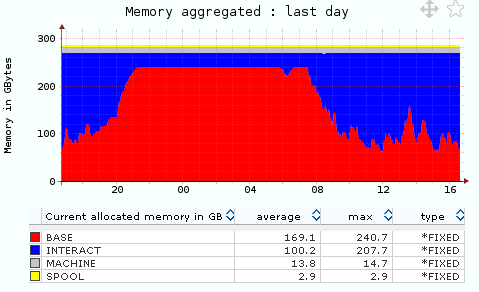 |
||
| THREADS | Current threads | yes | 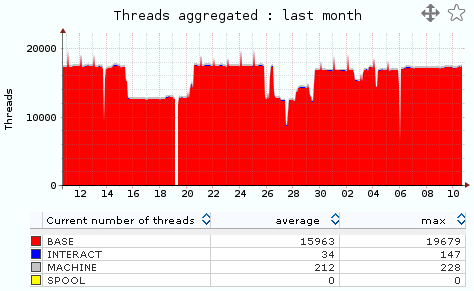 |
|||
| Faults | ||||||
| DB faults/sec | yes | WRKSYSSTS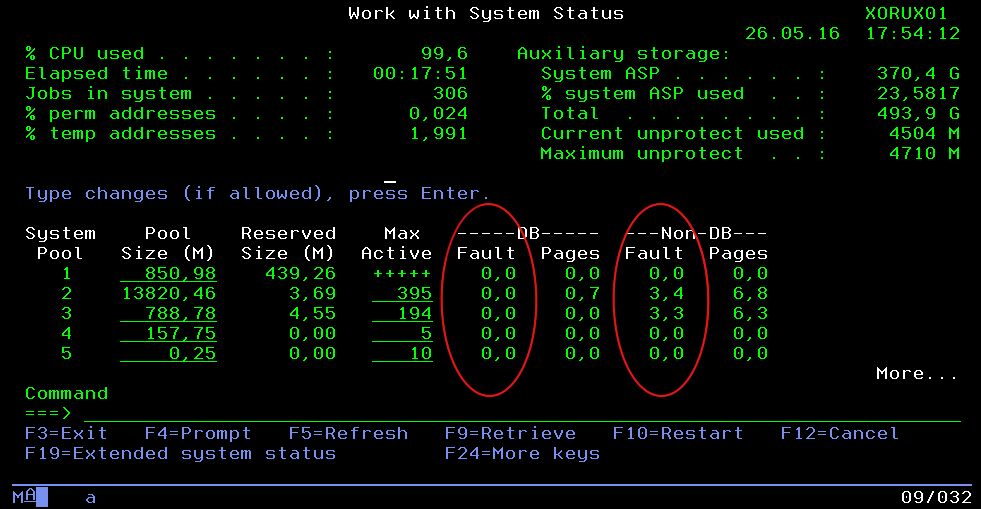 |
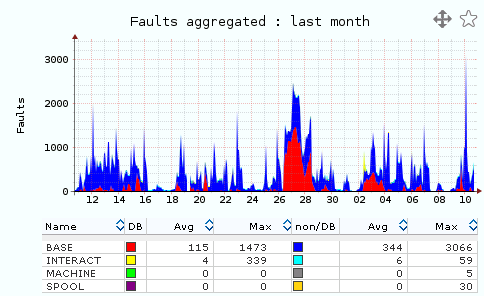 |
|||
| non DB faults/sec | yes | |||||
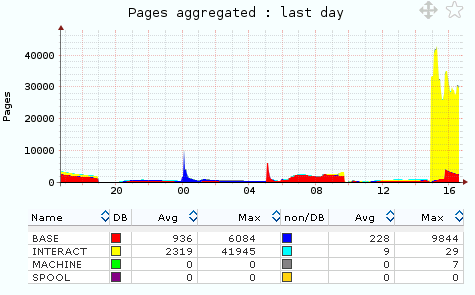
| Pages | ||||||
| DB pages/sec | yes | WRKSYSSTS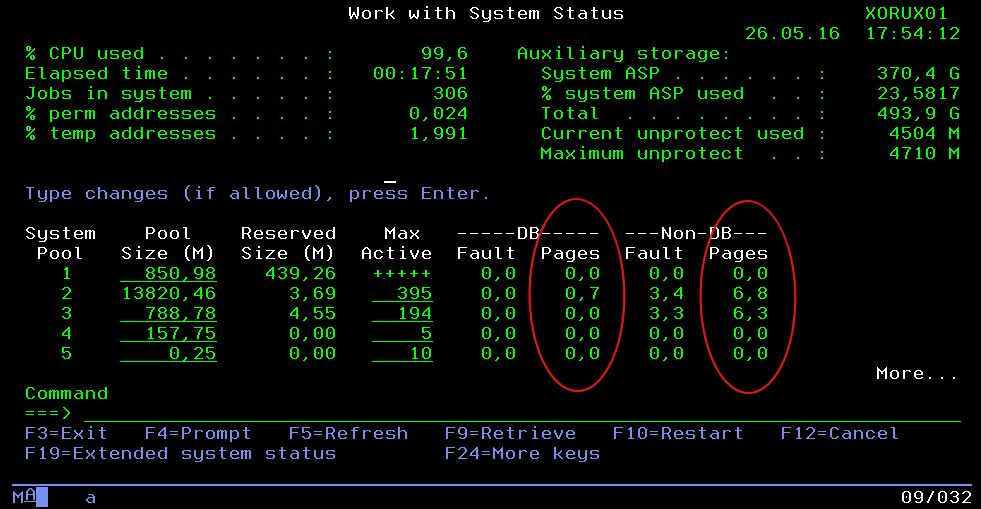 |
 |
|||
| non DB pages/sec | yes | |||||
| LAN |
||||||
| MB/sec | yes | 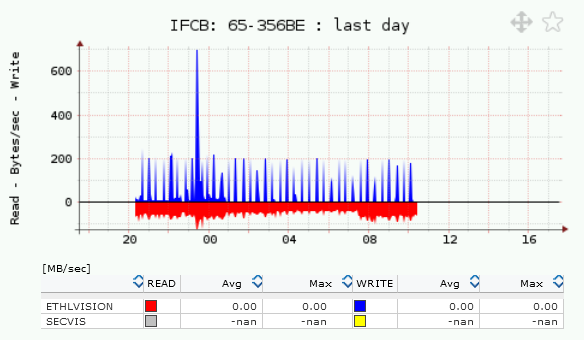 |
||||
| Packets/sec | yes | |||||
| Discarded/sec | yes |
CPU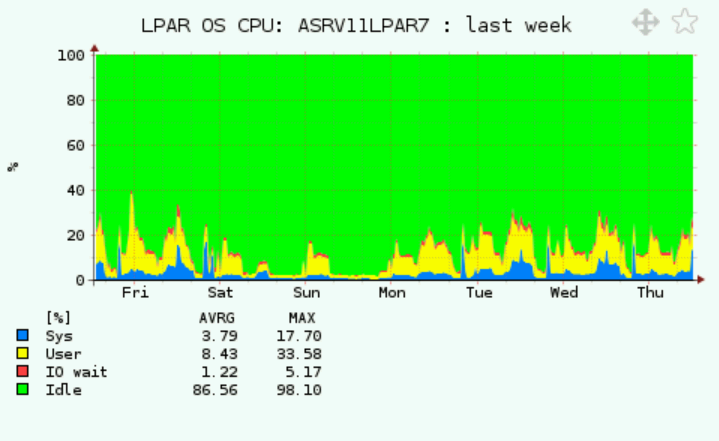 |
CPU Queue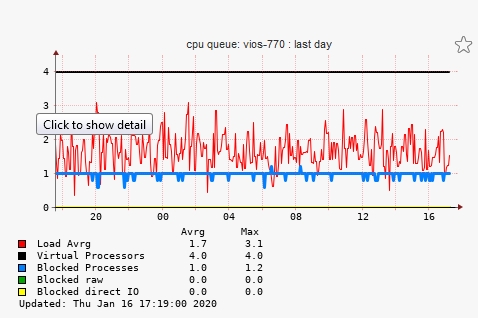 |
Memory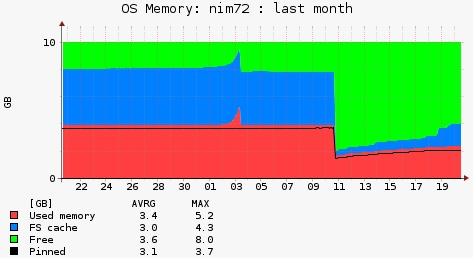 |
LAN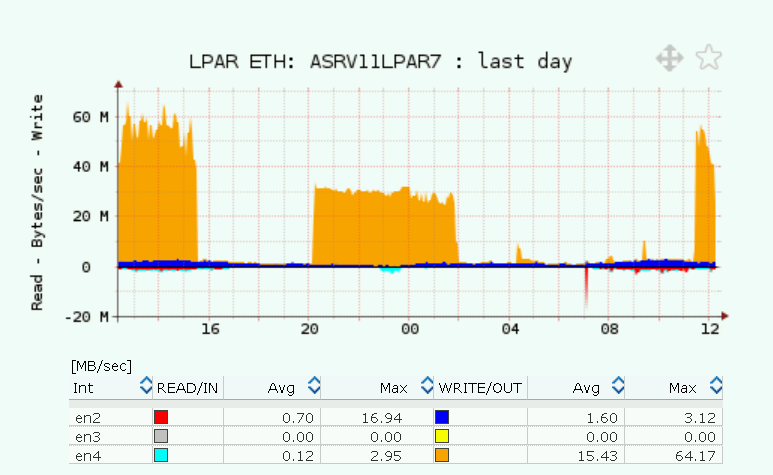 |
SAN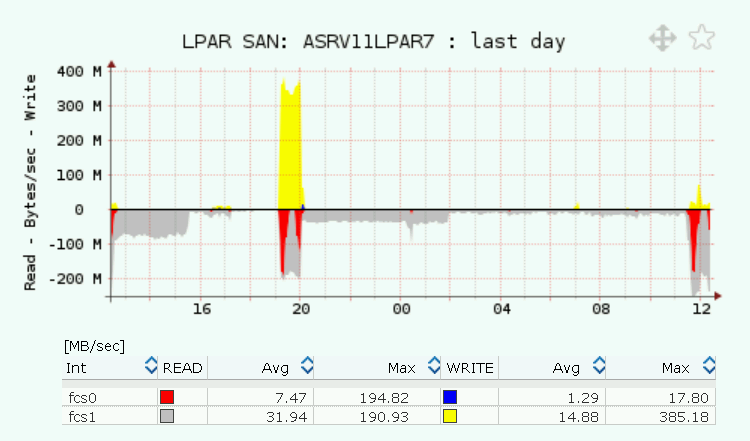 |
SAN IOPS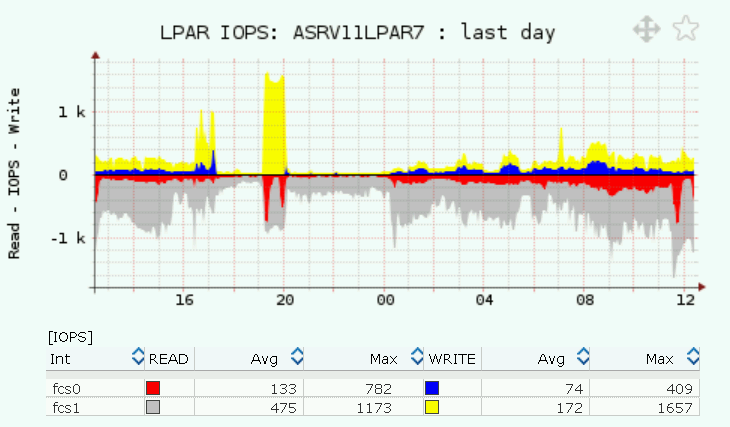 |
SAN RESP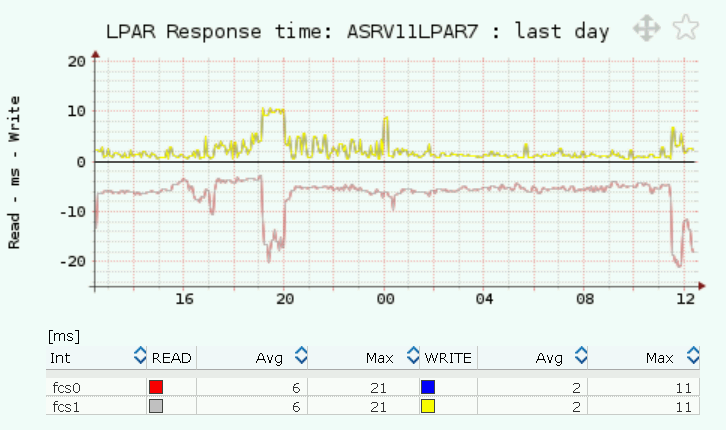 |
| OS CPU | CPU sys, user, IO wait |
| CPU queue | Load avrg, Blocked processes |
| JOB | CPU, Memory |
| Memory utilization | Used, FS cache |
| LAN (ethernet adapters) | MB/sec, packet count |
| SAN (FC,vSCSI adapters) | MB/sec, packets/sec, Latency |
| Paging space utilization | Usage in % |
| Paging rate | MB/sec |
| Filesystem usage | Usage in %, GB |
| Subsystem | Metric | SQL Server instance | Database |
|---|---|---|---|
| Health status | Health status | yes | |
| DB TOP | IOPS | yes | |
| DATA in MB | yes | ||
| User Connections | yes | ||
| Configuration | Main | yes | |
| Memory | Memory | yes | |
| Buffers | Buffer | yes | |
| Readahead | yes | ||
| Page R/W | yes | ||
| Pages | yes | ||
| Sessions | Sessions | yes | |
| Latches | IO | yes | |
| Buffer | yes | ||
| Non Buffer | yes | ||
| Wait events | Events | yes | |
| Capacity | Size | yes | |
| Relations | yes | ||
| Filegroups | yes | ||
| IO | Total | yes | |
| Read/Write | yes | ||
| Data | Total | yes | |
| Read/Write | yes | ||
| Latency | Total | yes | |
| Read/Write | yes | ||
| Locks | Locks | yes | |
| Deadlocks | yes | ||
| SQL Querty | Transactions | yes | |
| Cursors | yes | ||
| Ratio | Cache hit | yes | |
| Buffer Cache hit | yes | ||
| Log Cache hit | yes |
Collected Metrics
-
Node
- CPU %
- CPU
- Memory
- Swap
- CPU IO wait
- OS Disk capacity
-
VM
- CPU %
- CPU
- Memory
- Data
- Net
-
LXC
- CPU %
- CPU
- Memory
- Data
- Net
-
Storage
- Capacity
You can see implementation on Free Demo
Examples
Node CPU%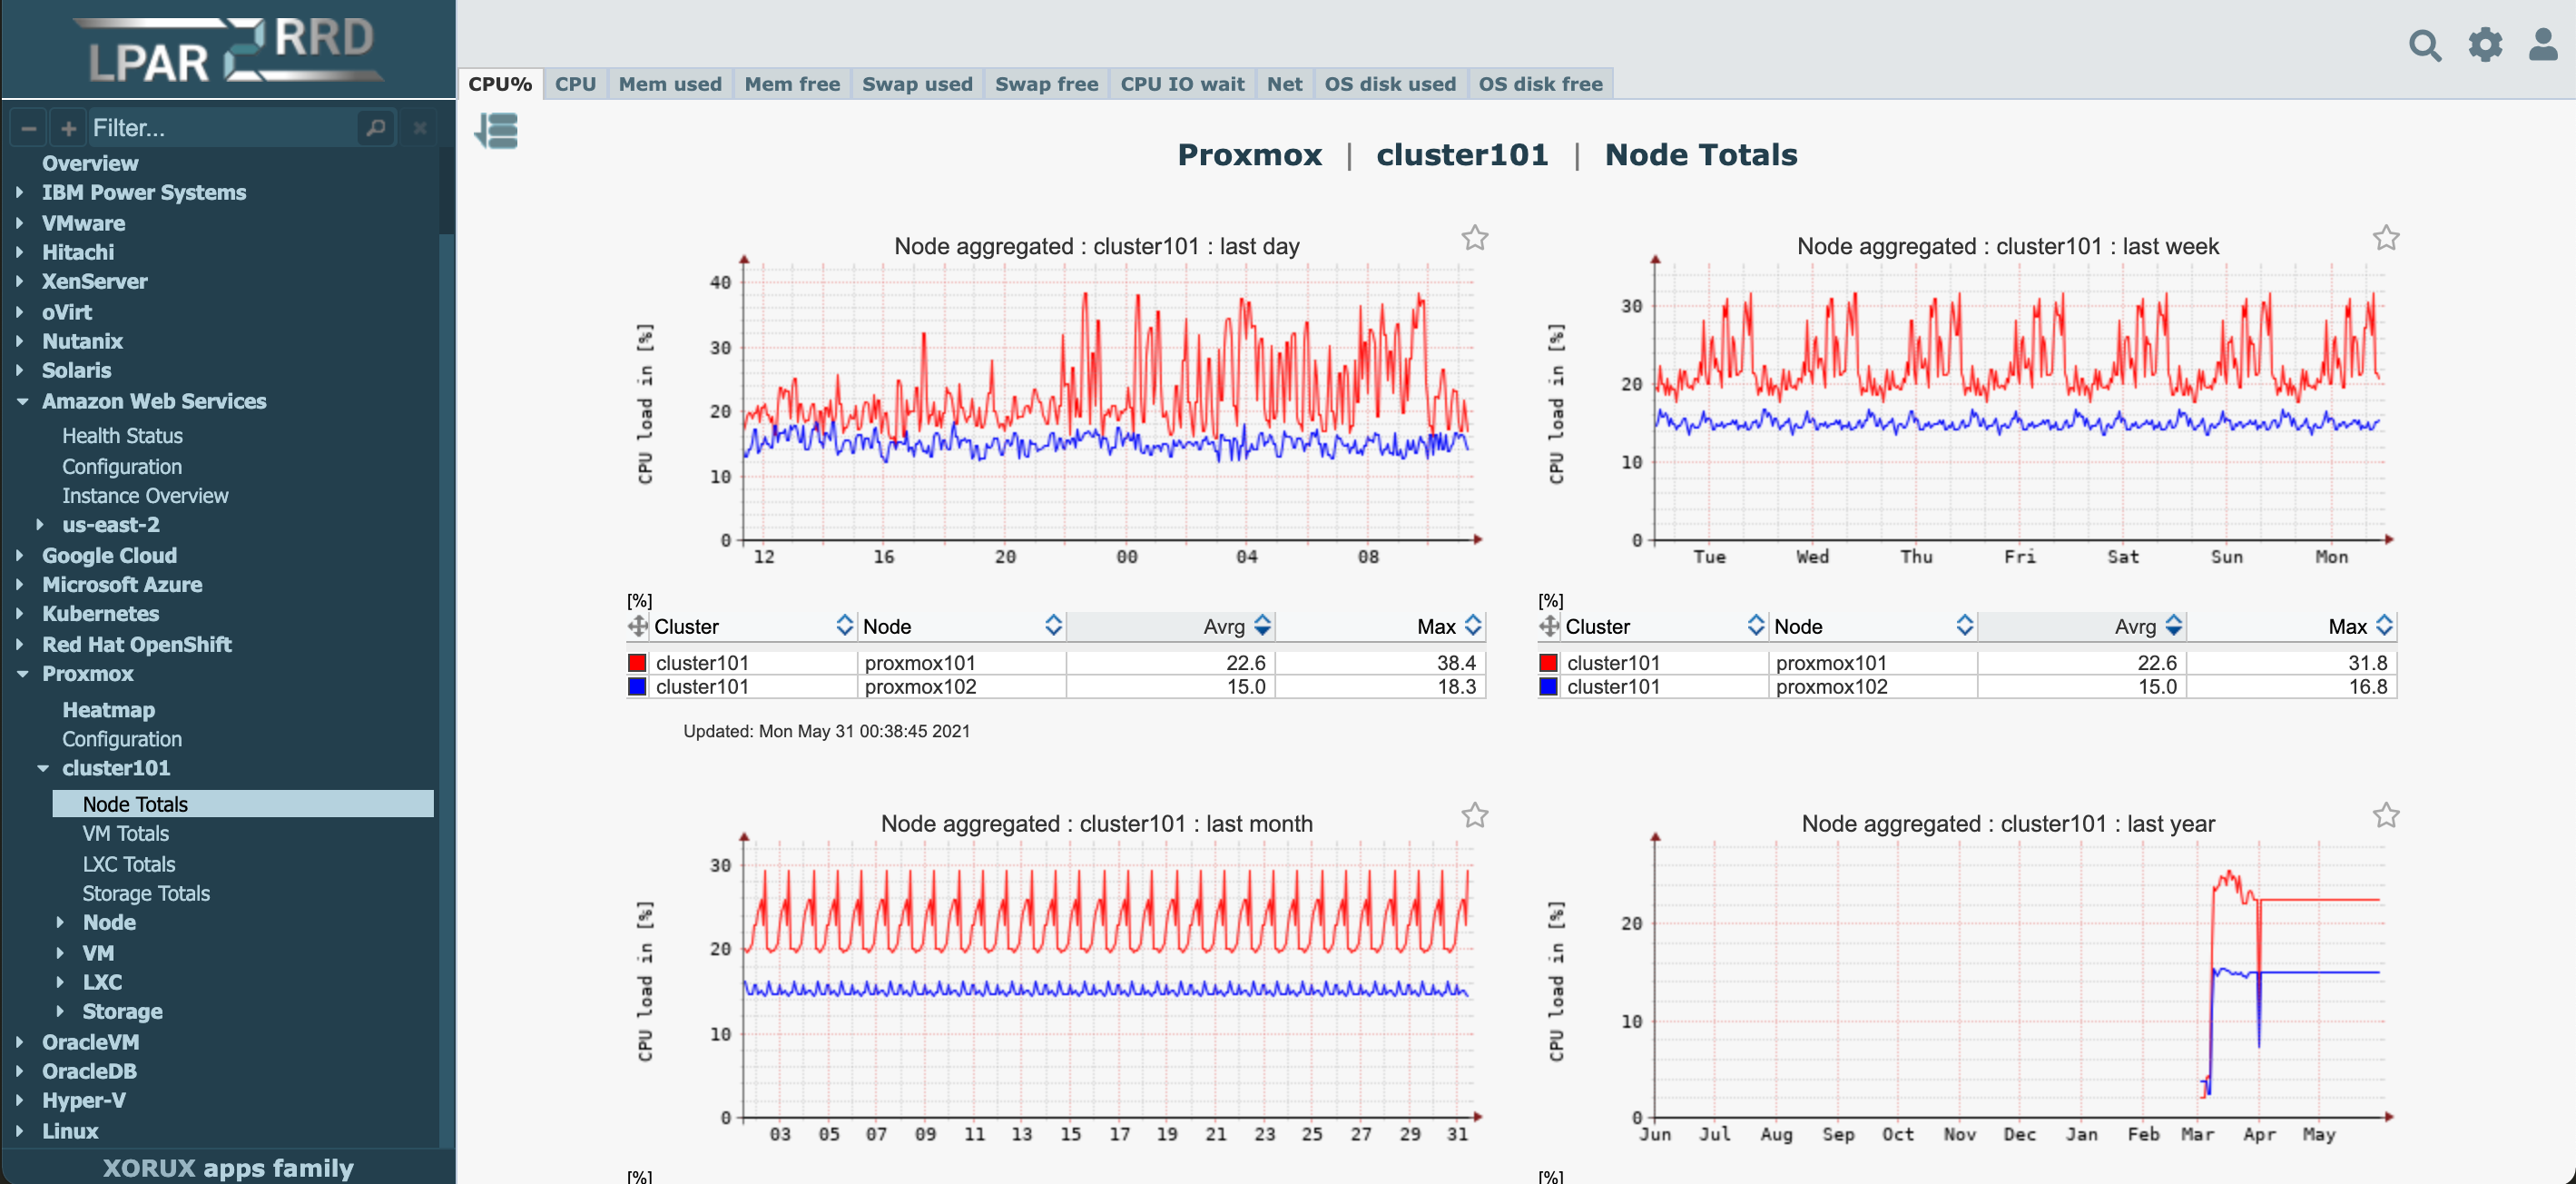 |
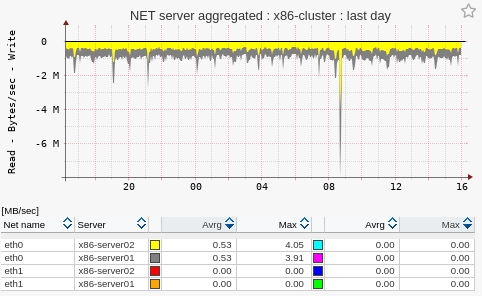
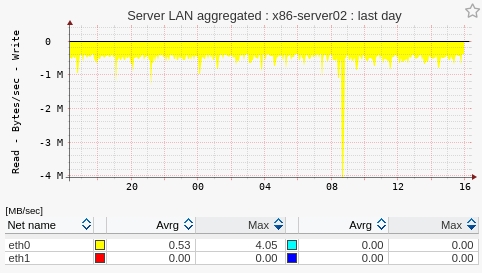
Node net aggr 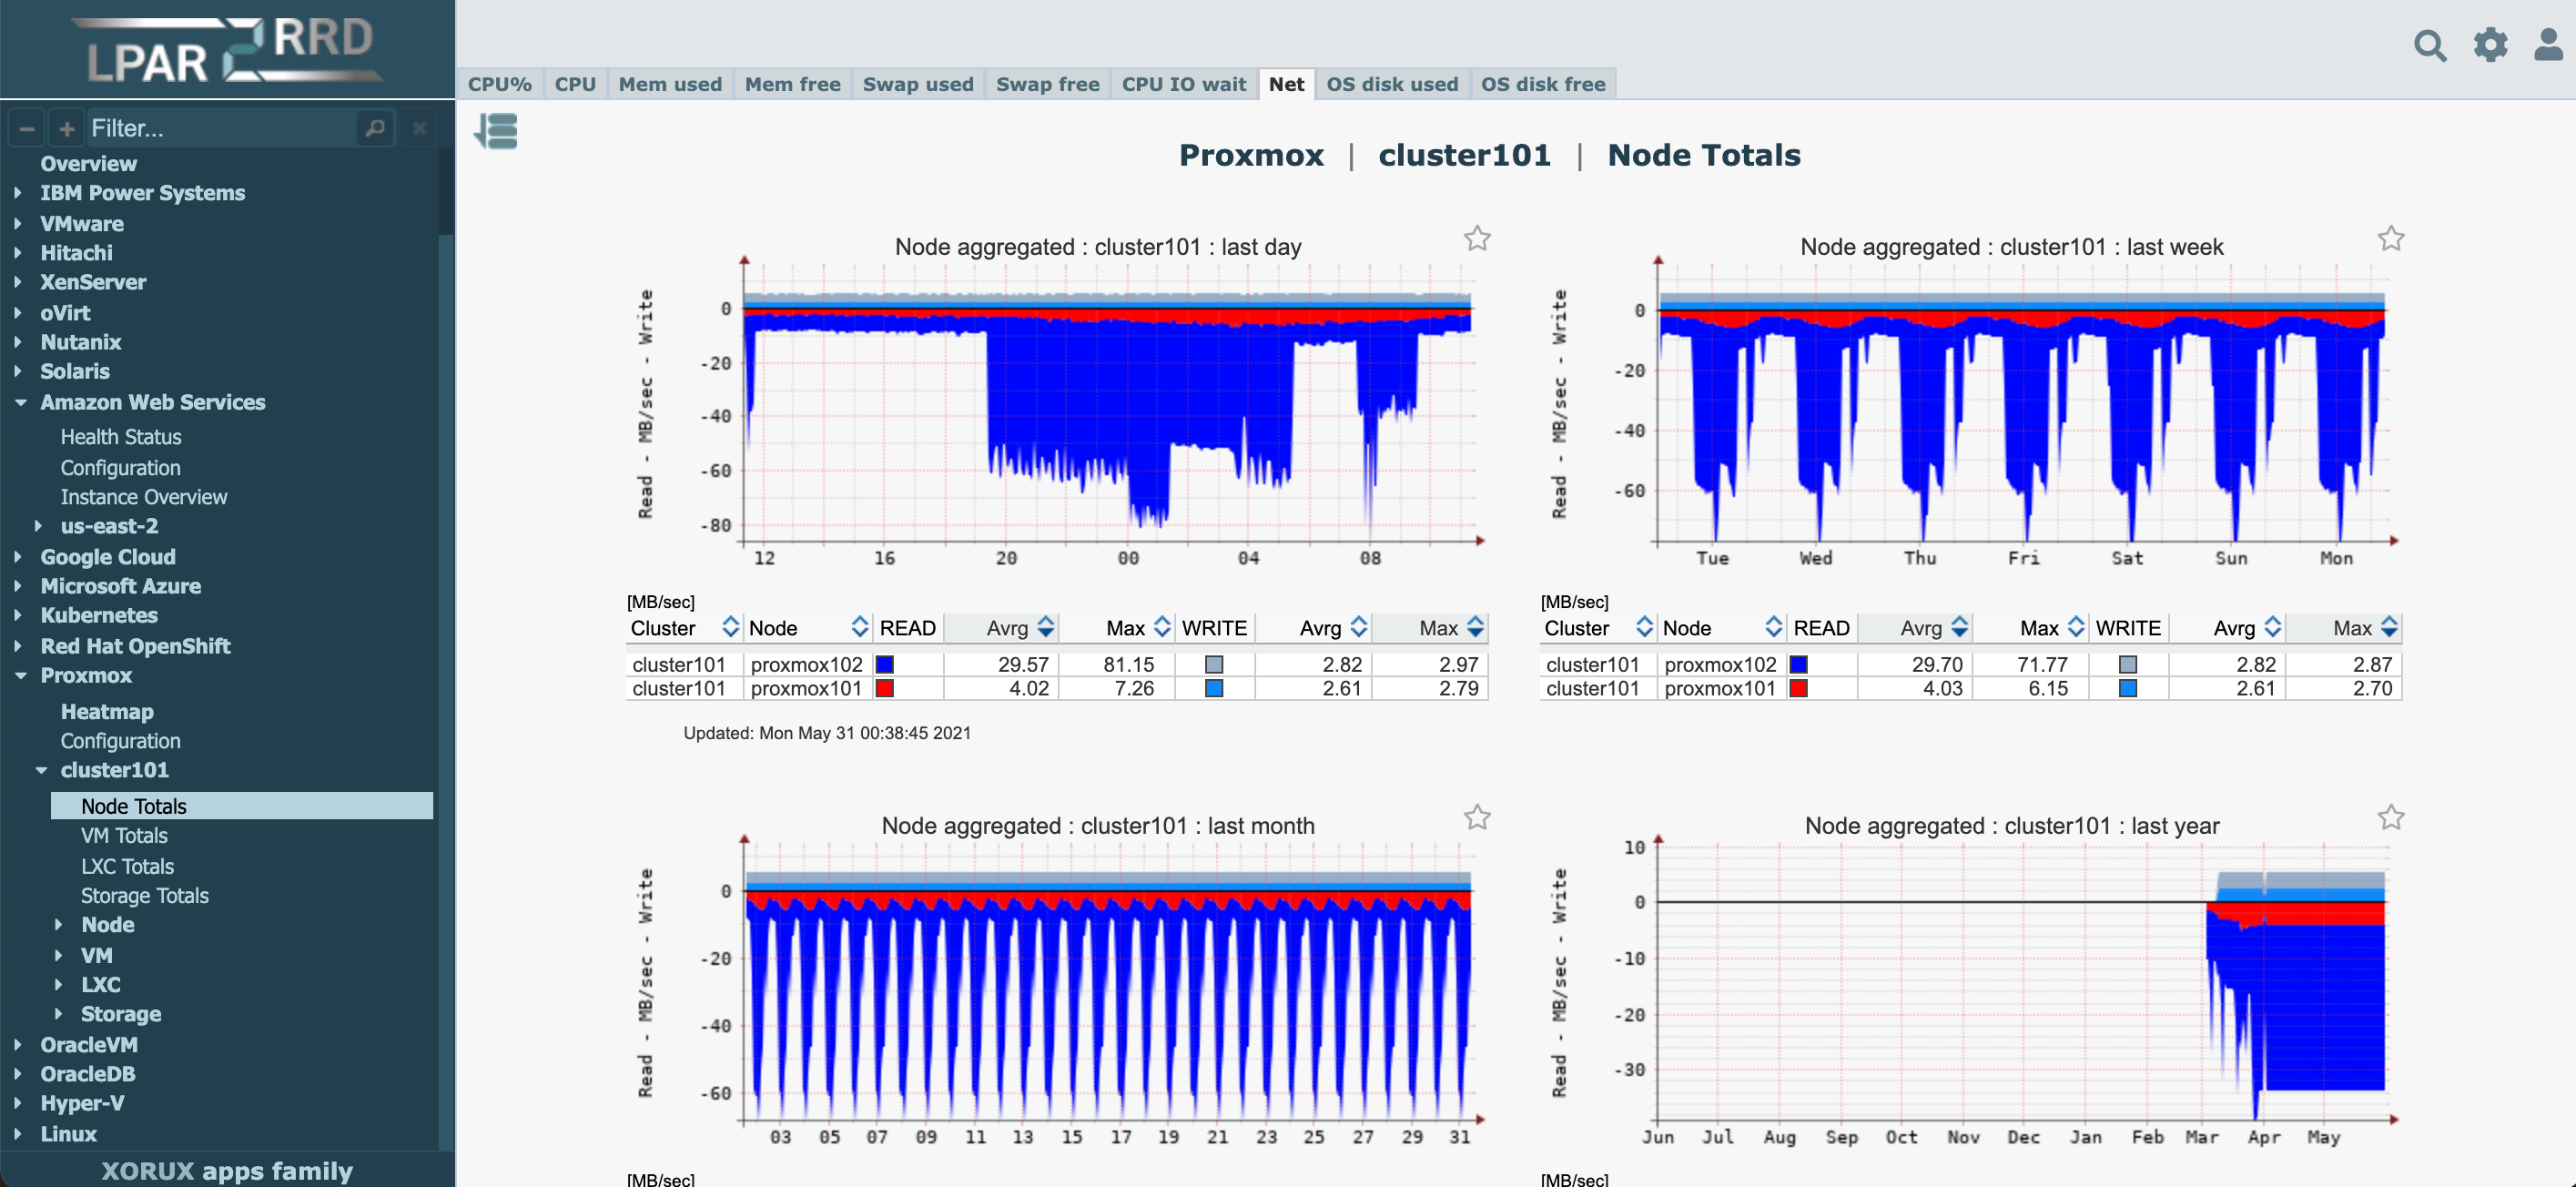 |
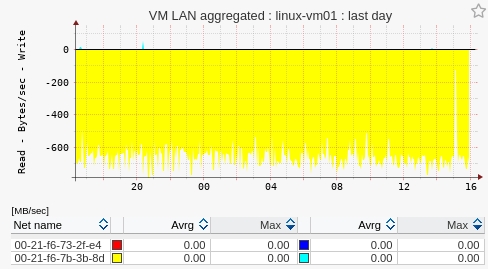
VM CPU 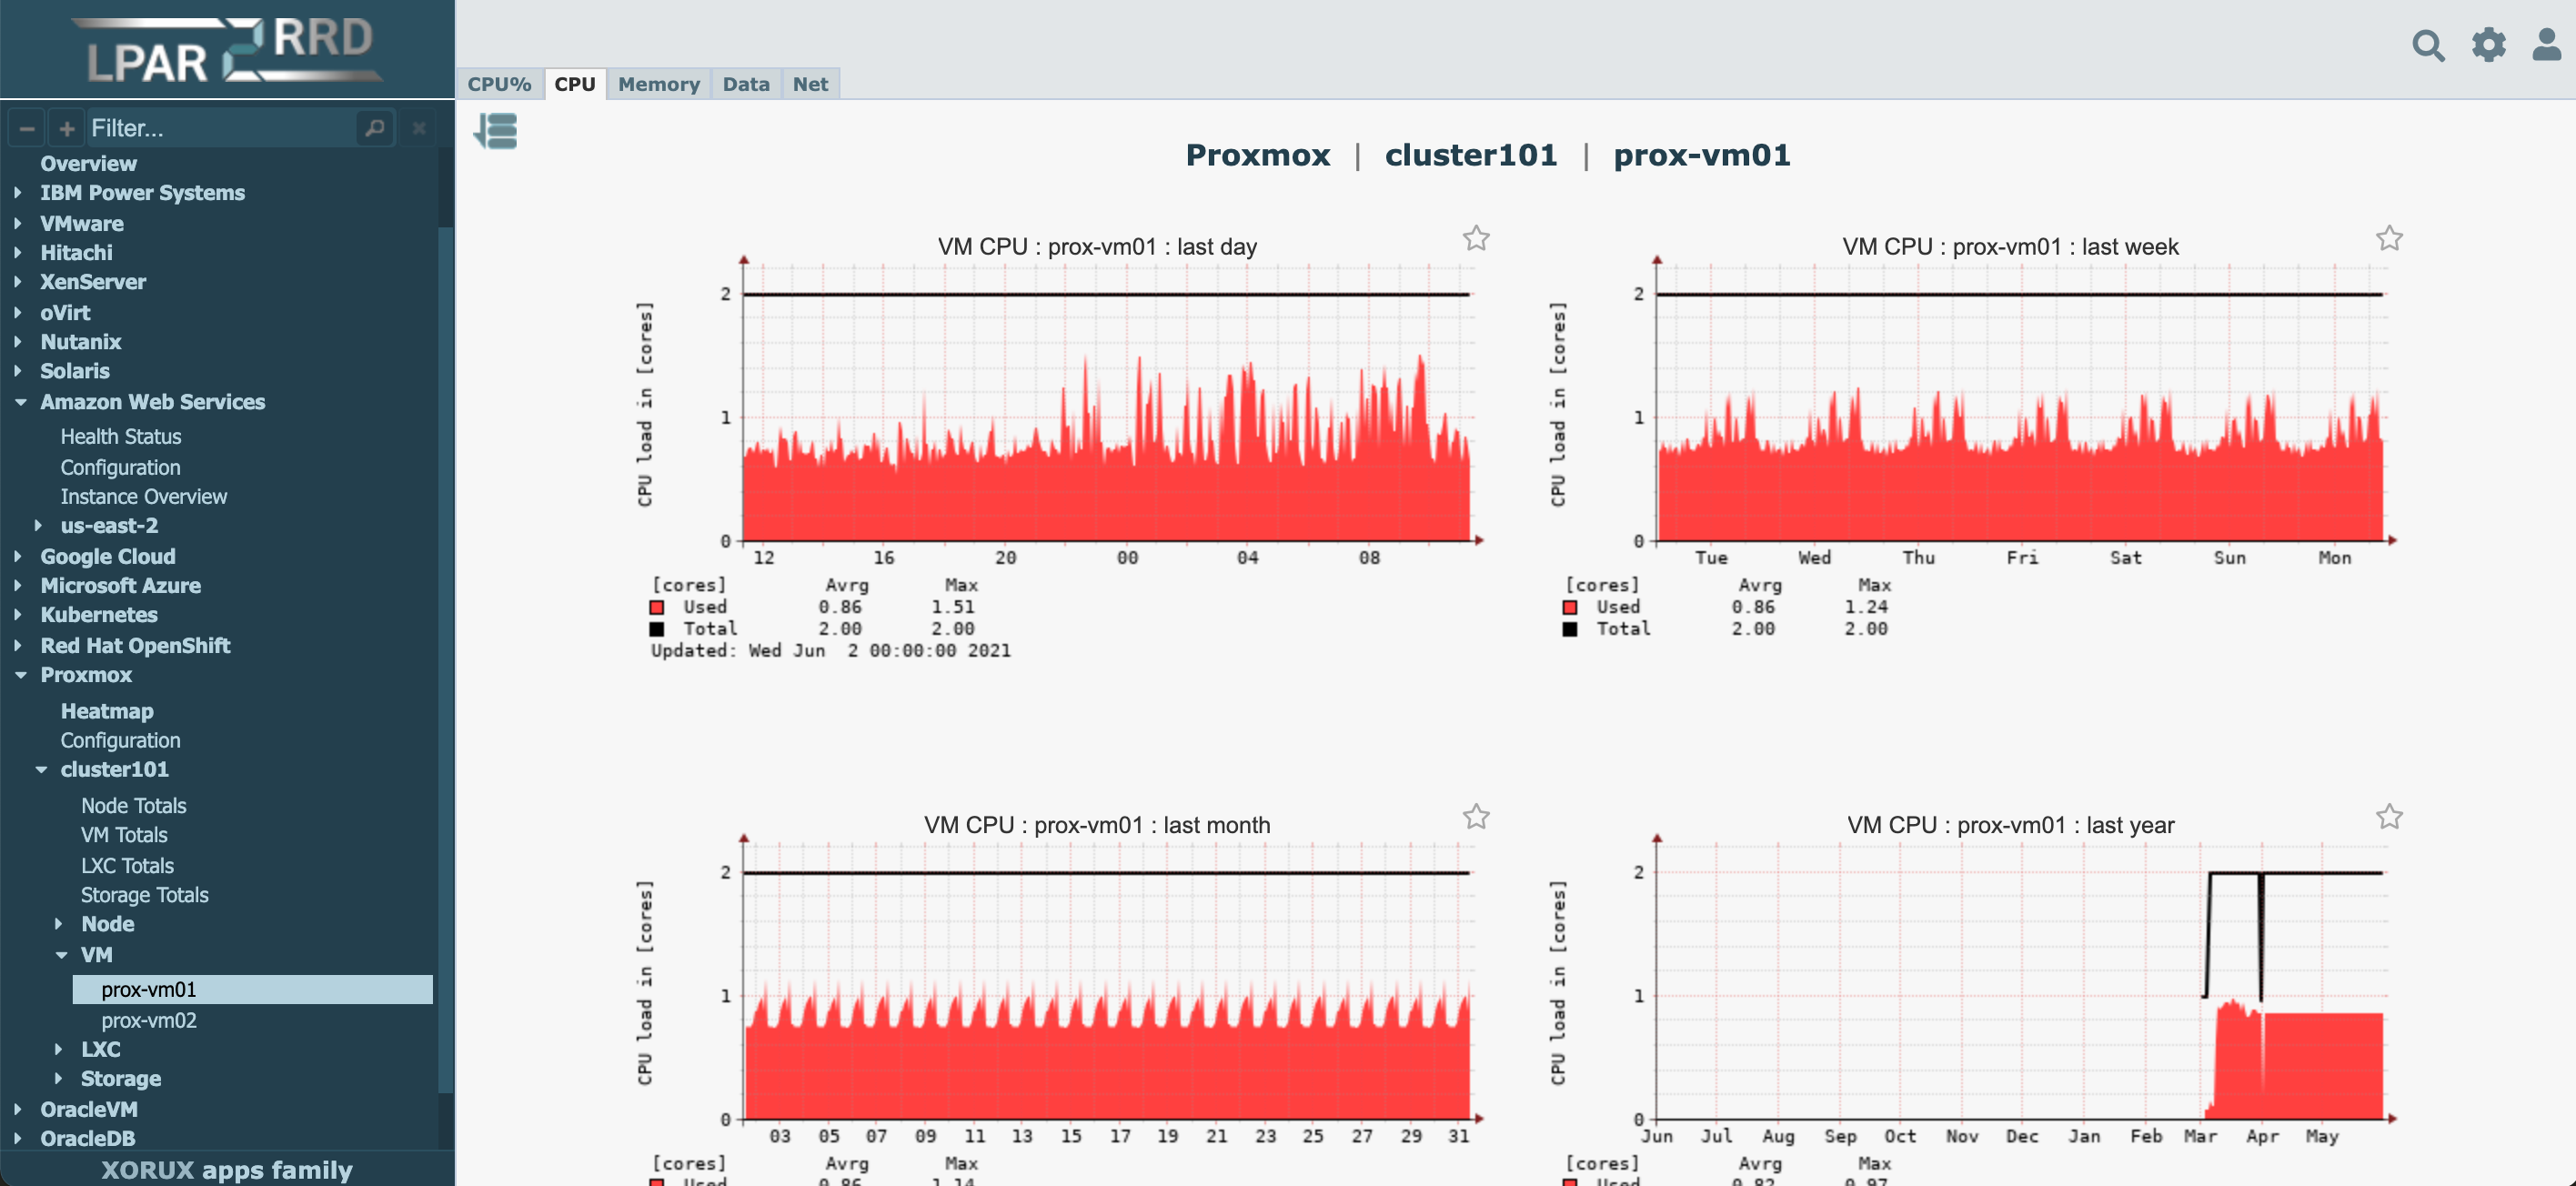 |
Storage free capacity aggr 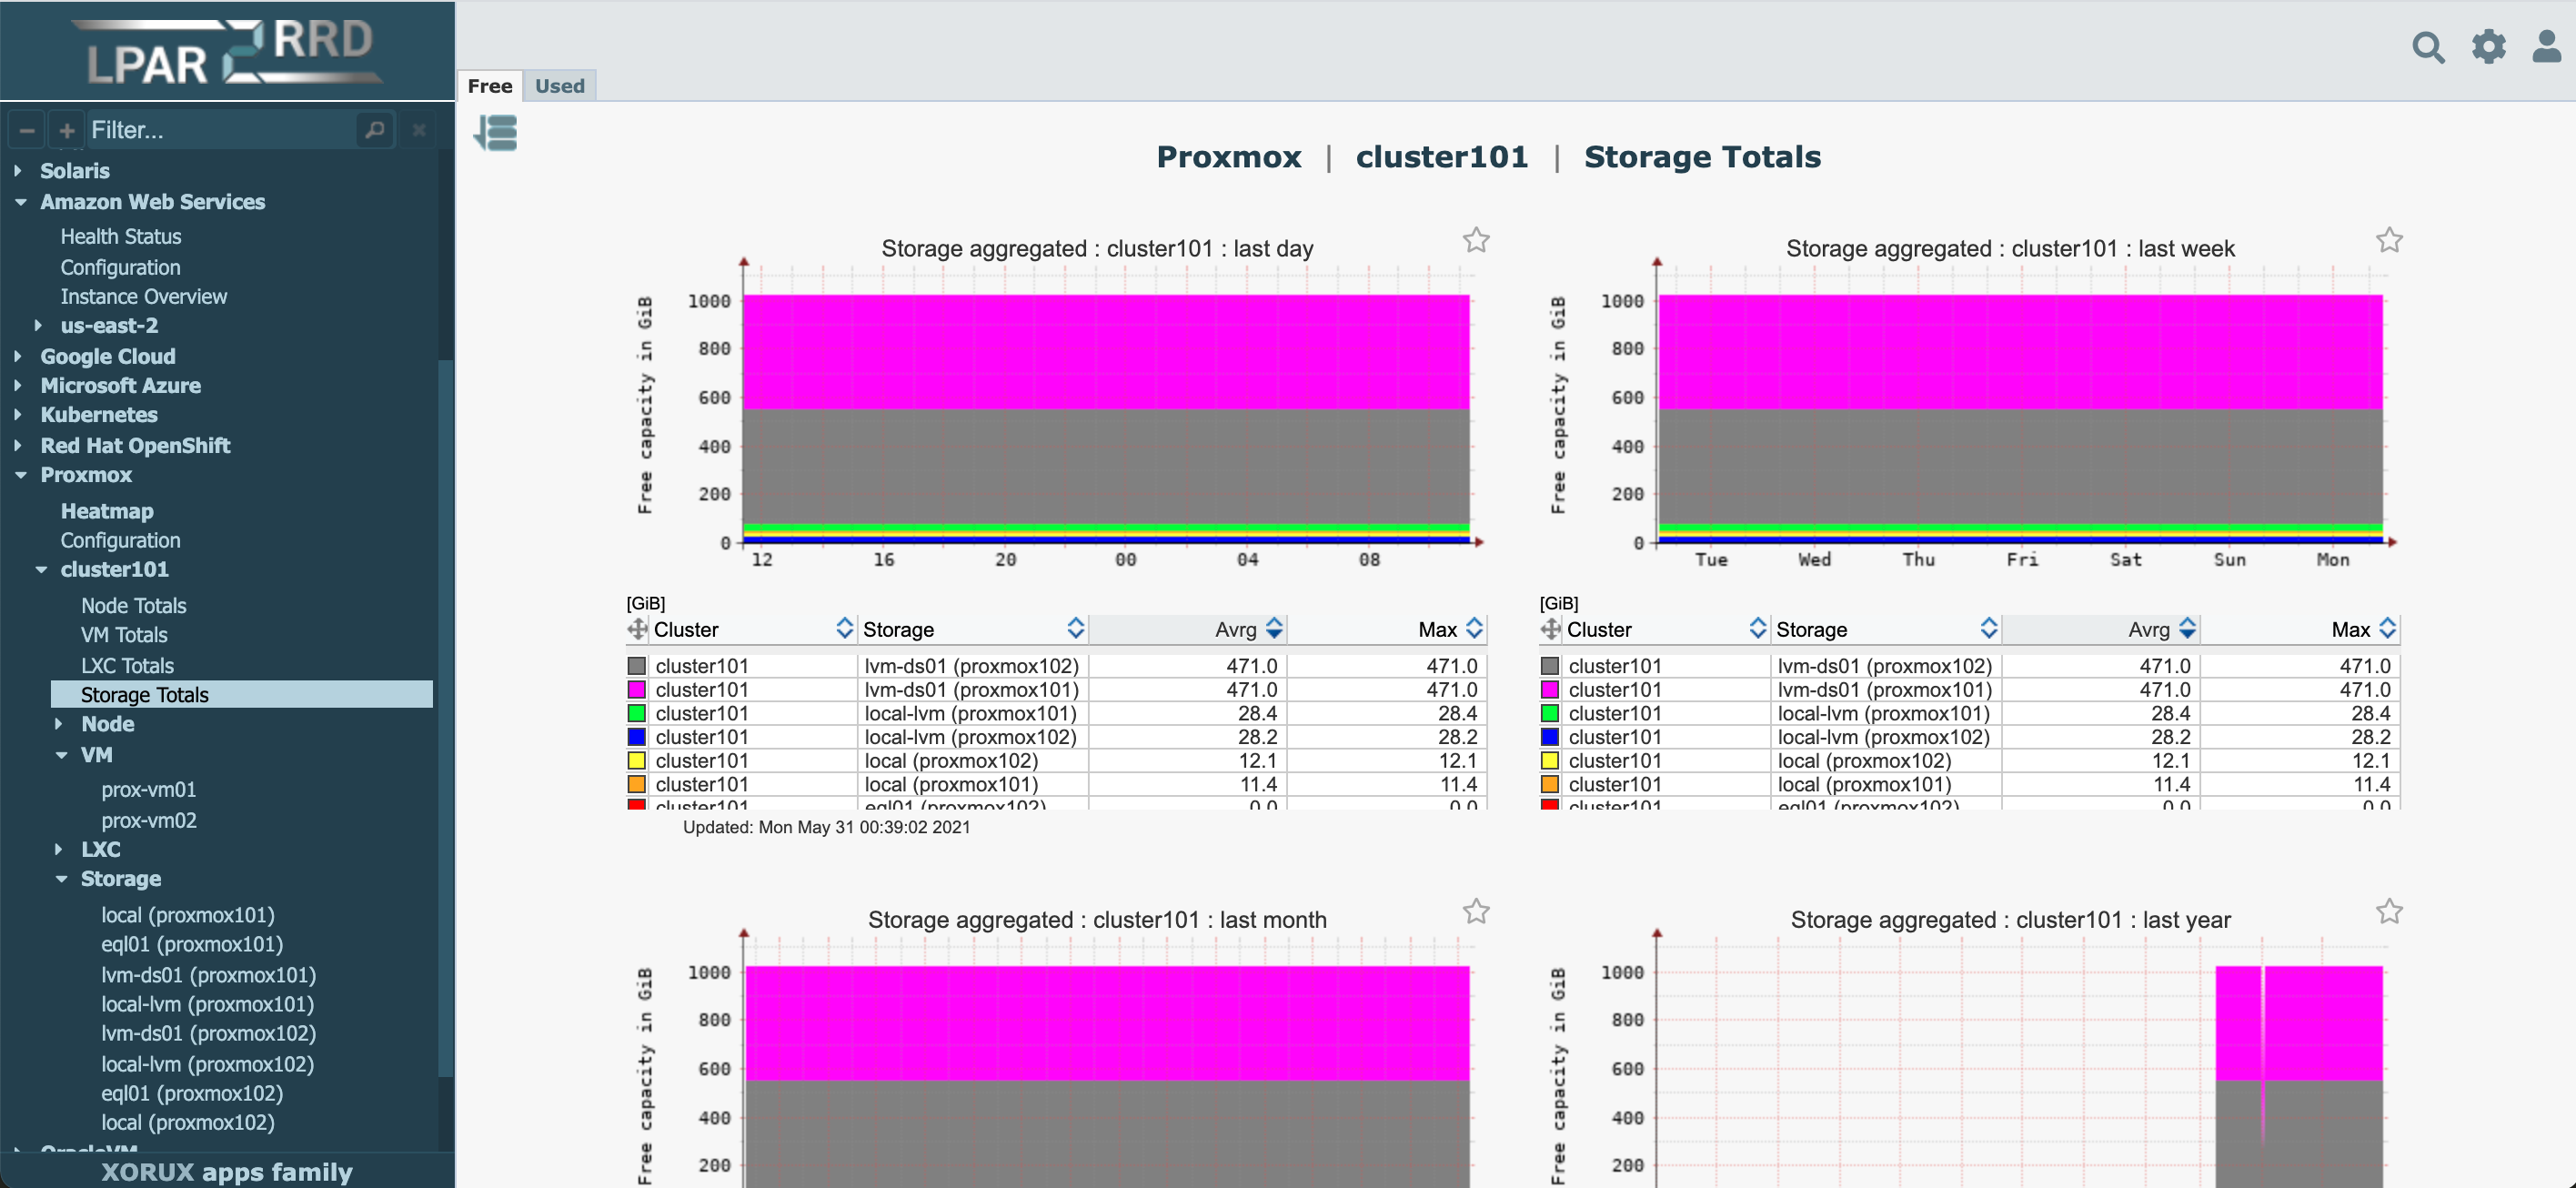 |
VM heatmap 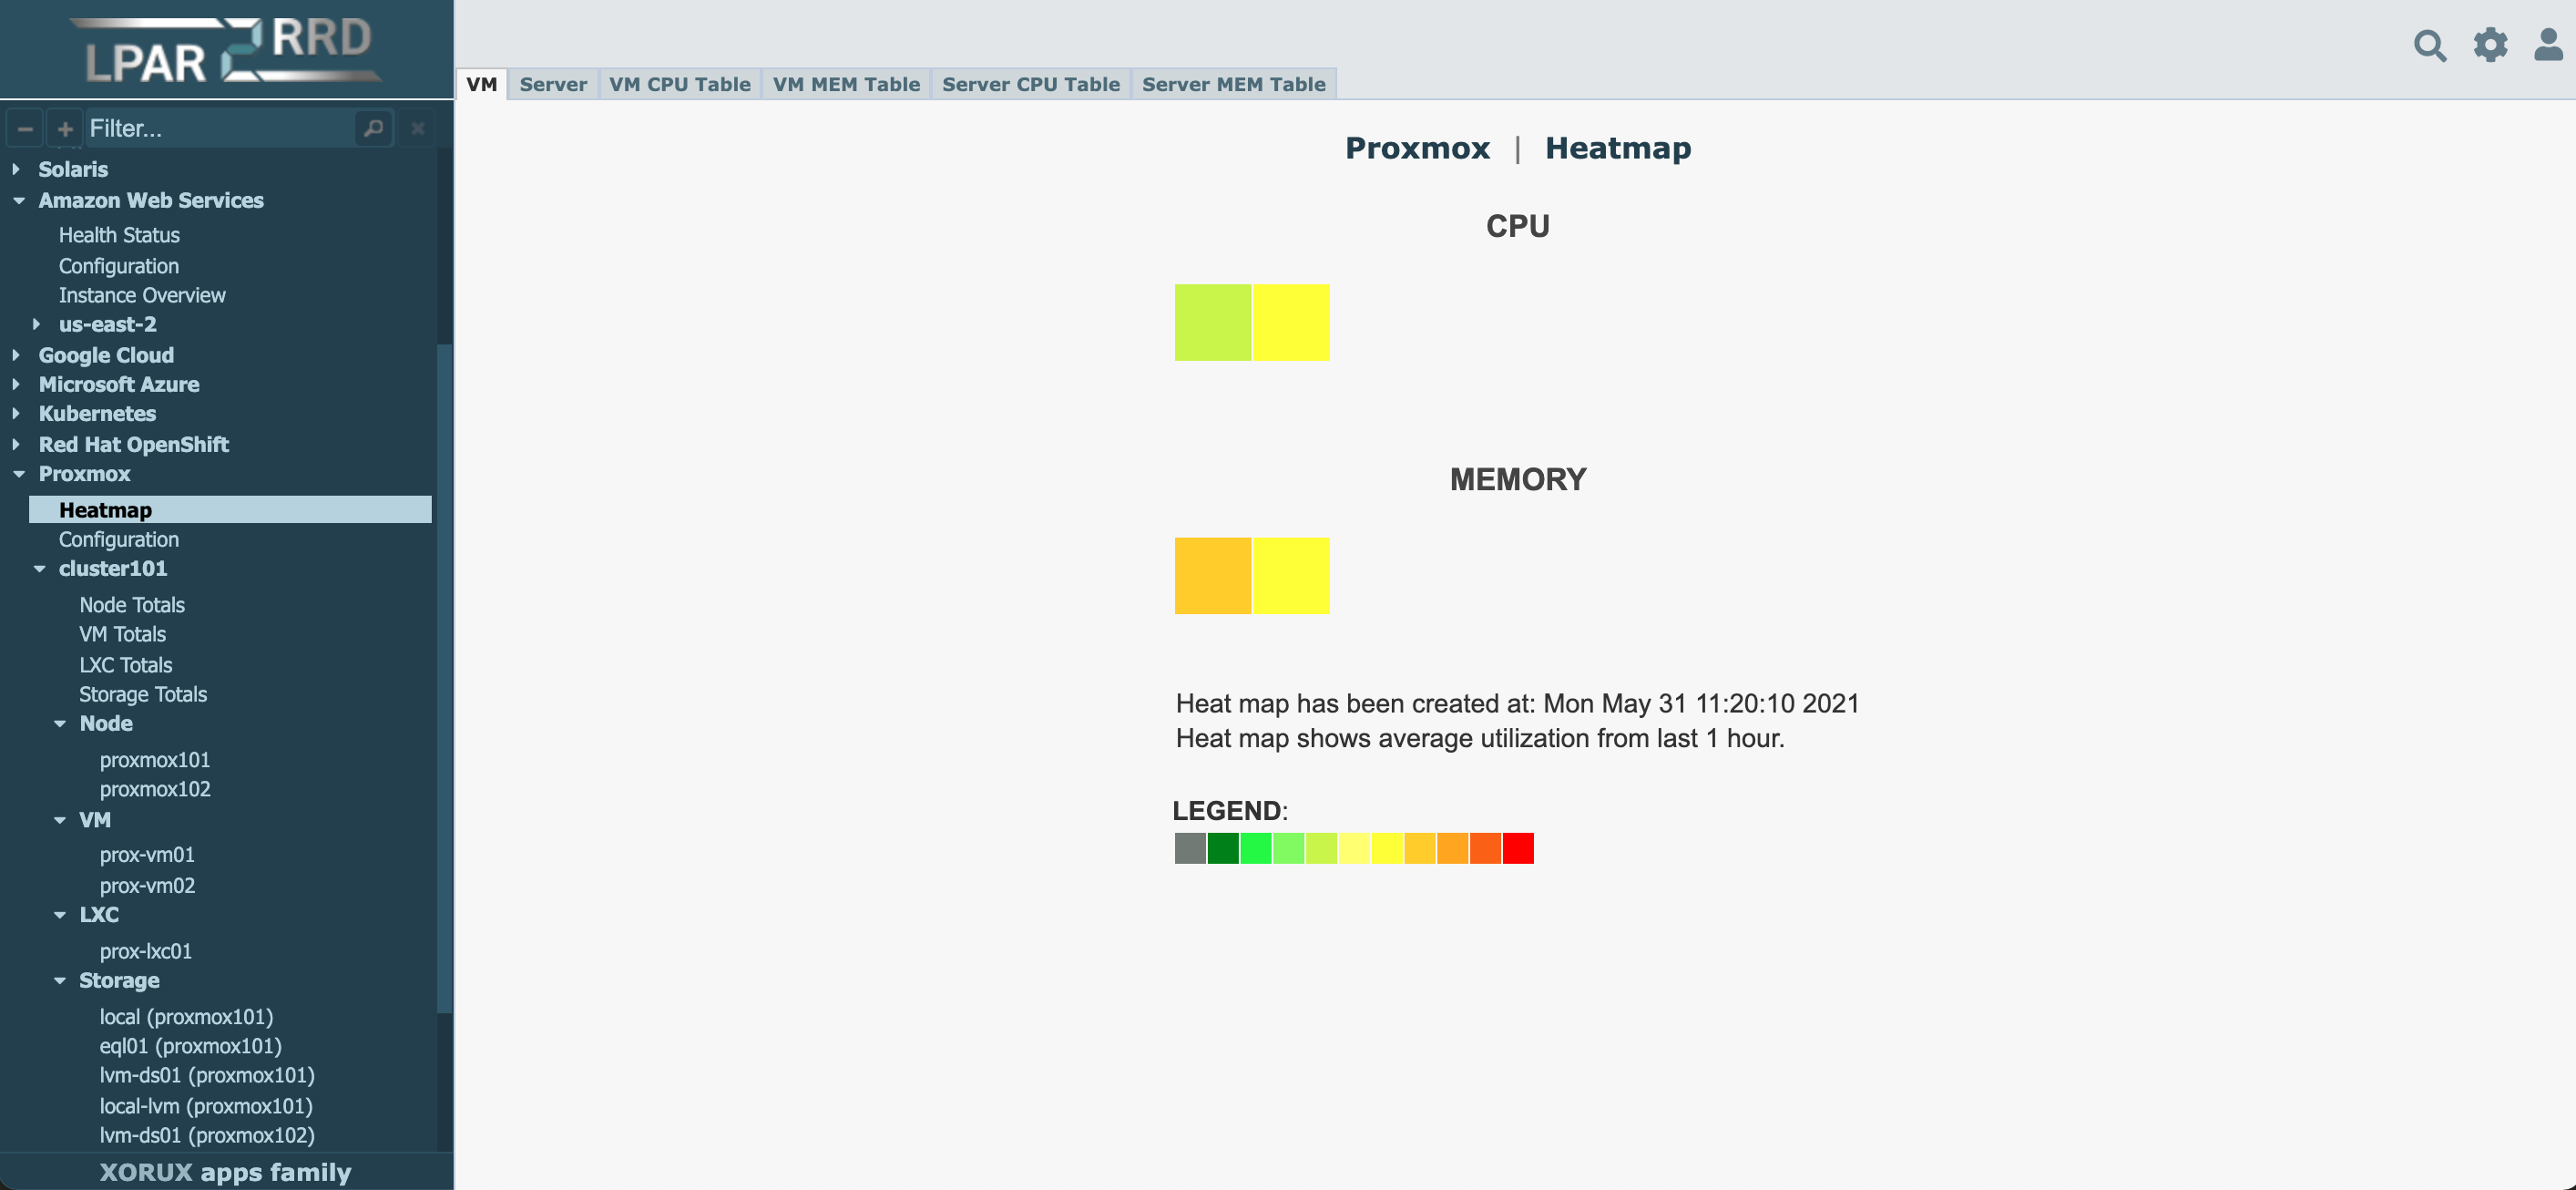 |
Collected Metrics
-
Node
- CPU %
- CPU
- Memory
- Data
- IOPS
- Net
- Net usage
- Packets
- Packets drop
- Disk usage
-
VM
- CPU %
- CPU
- Memory
- Data
- IOPS
- Latency
- Disk usage
- Net
- Packets drop
-
Datastore
- Capacity
Other Monitoring Features
You can see implementation on Free Demo
Examples
VM Heatmap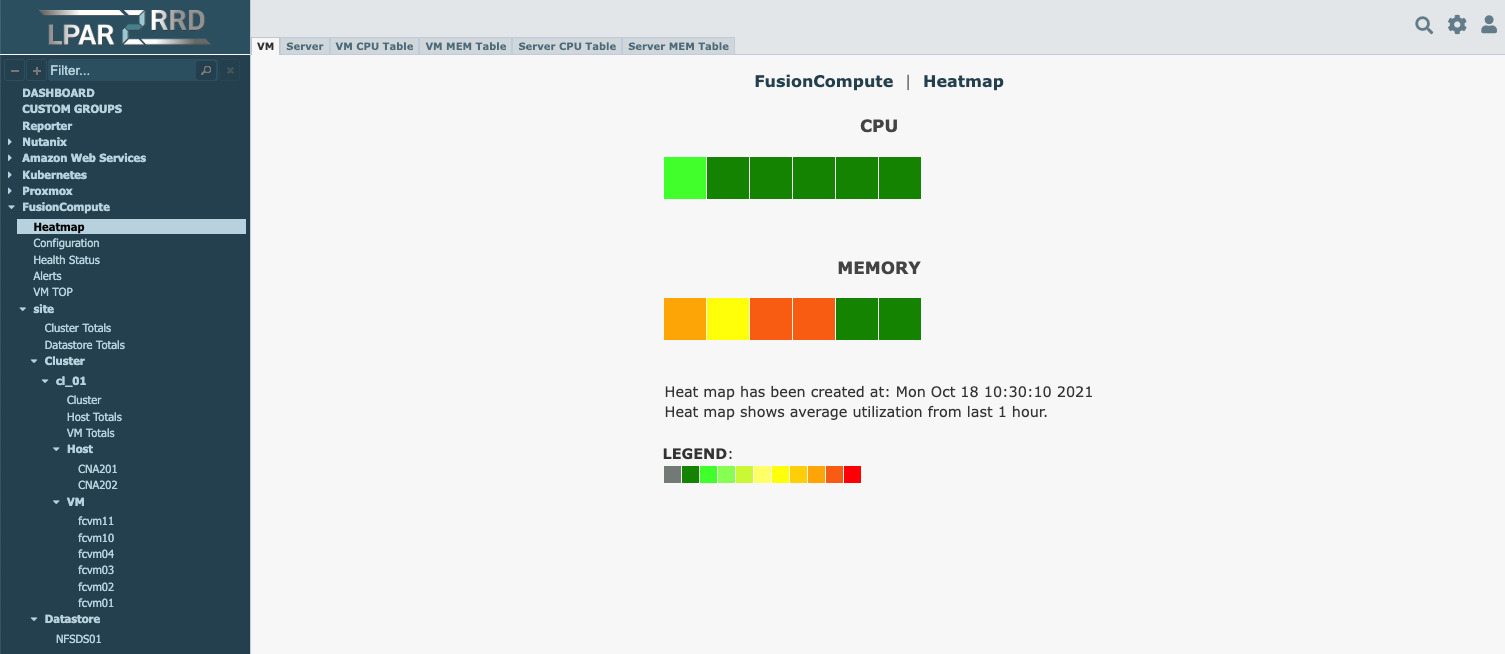 |
Node net aggr 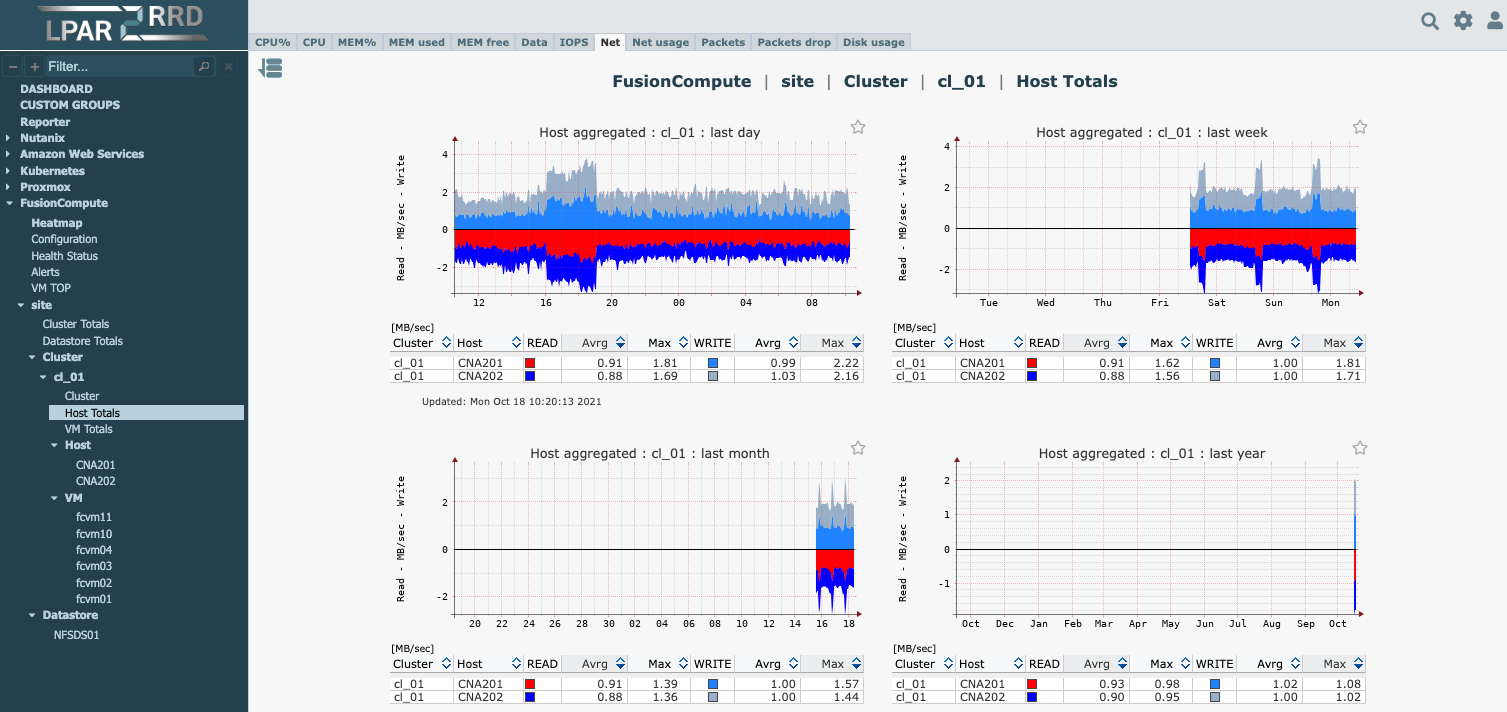 |
VM CPU aggr 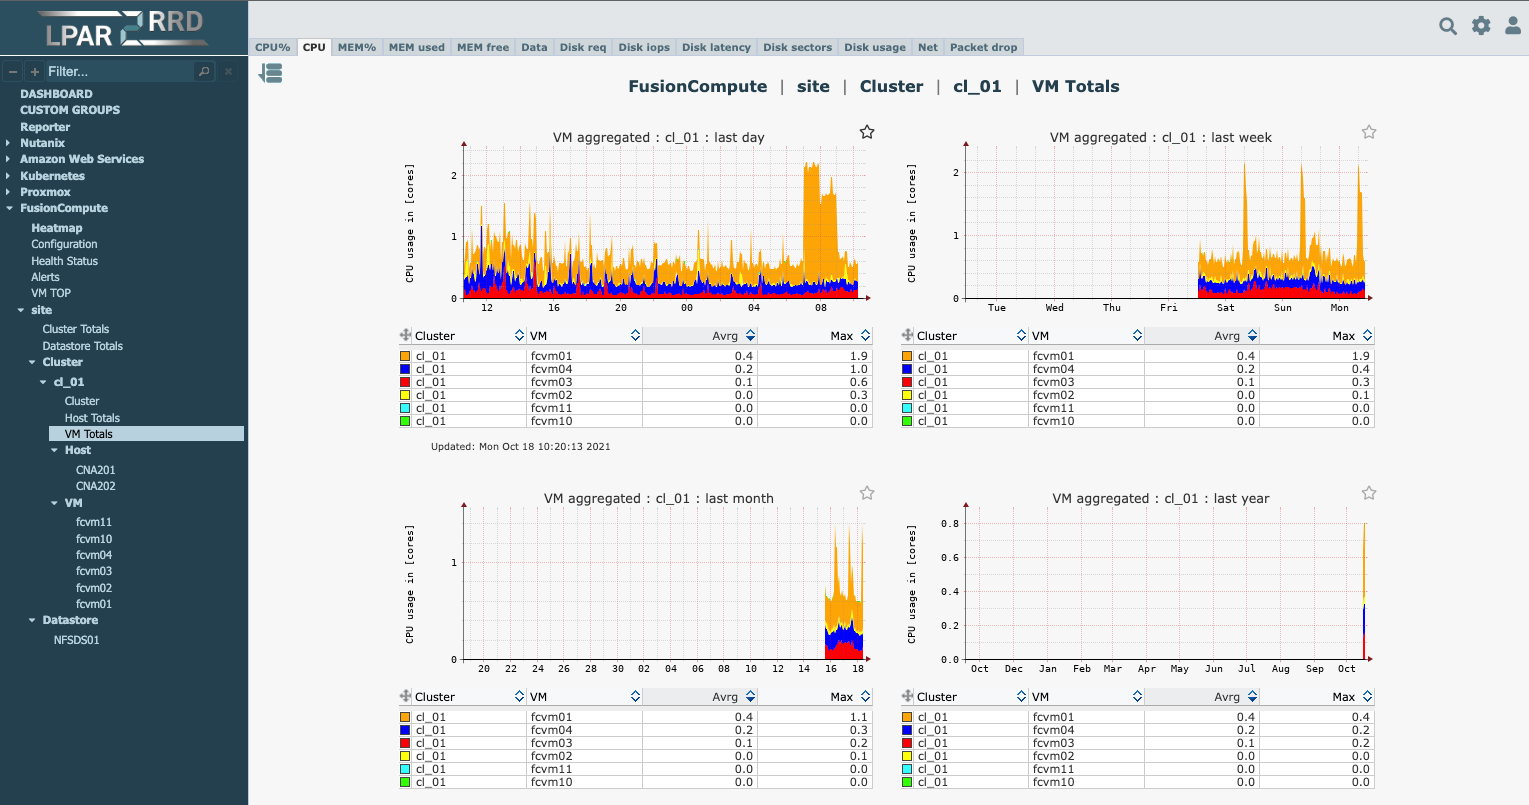 |
VM memory 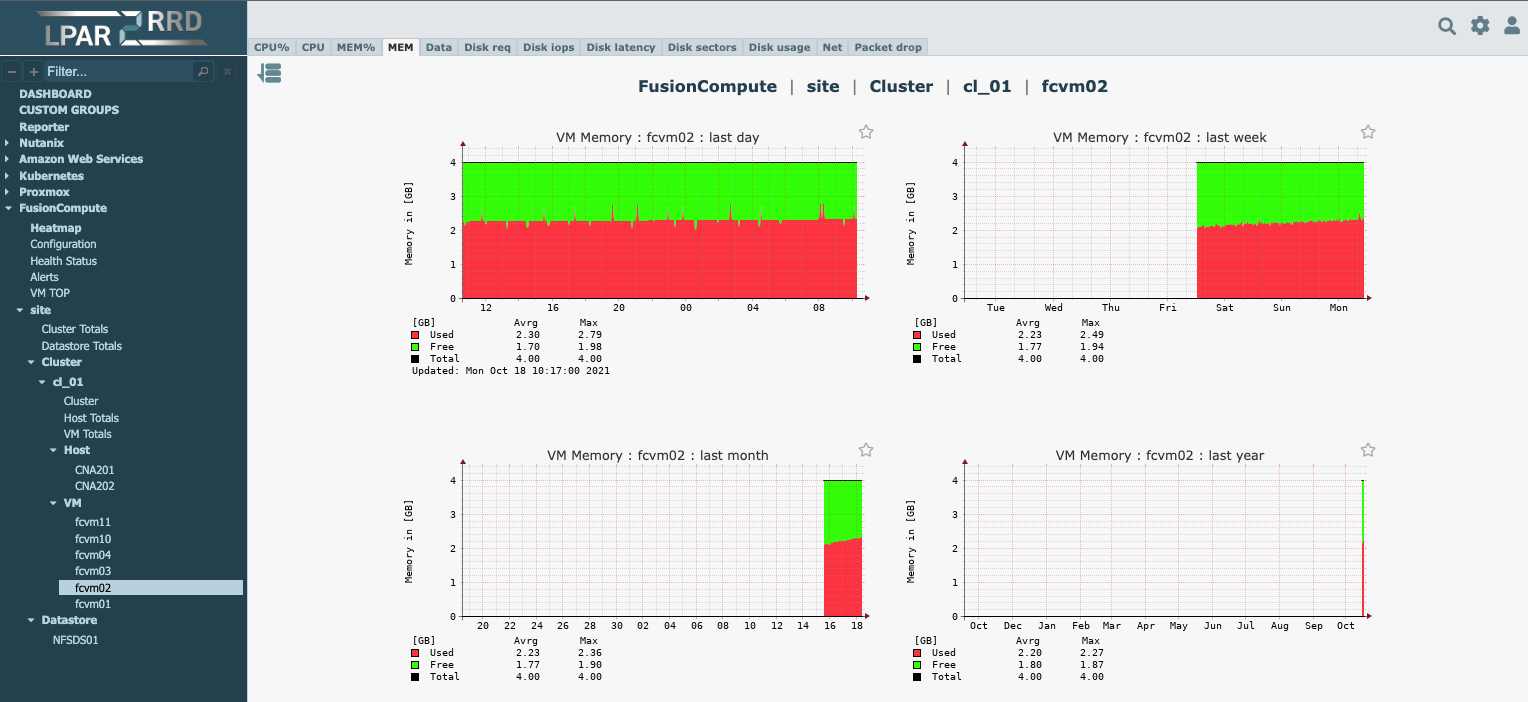 |
VM CPU under Node 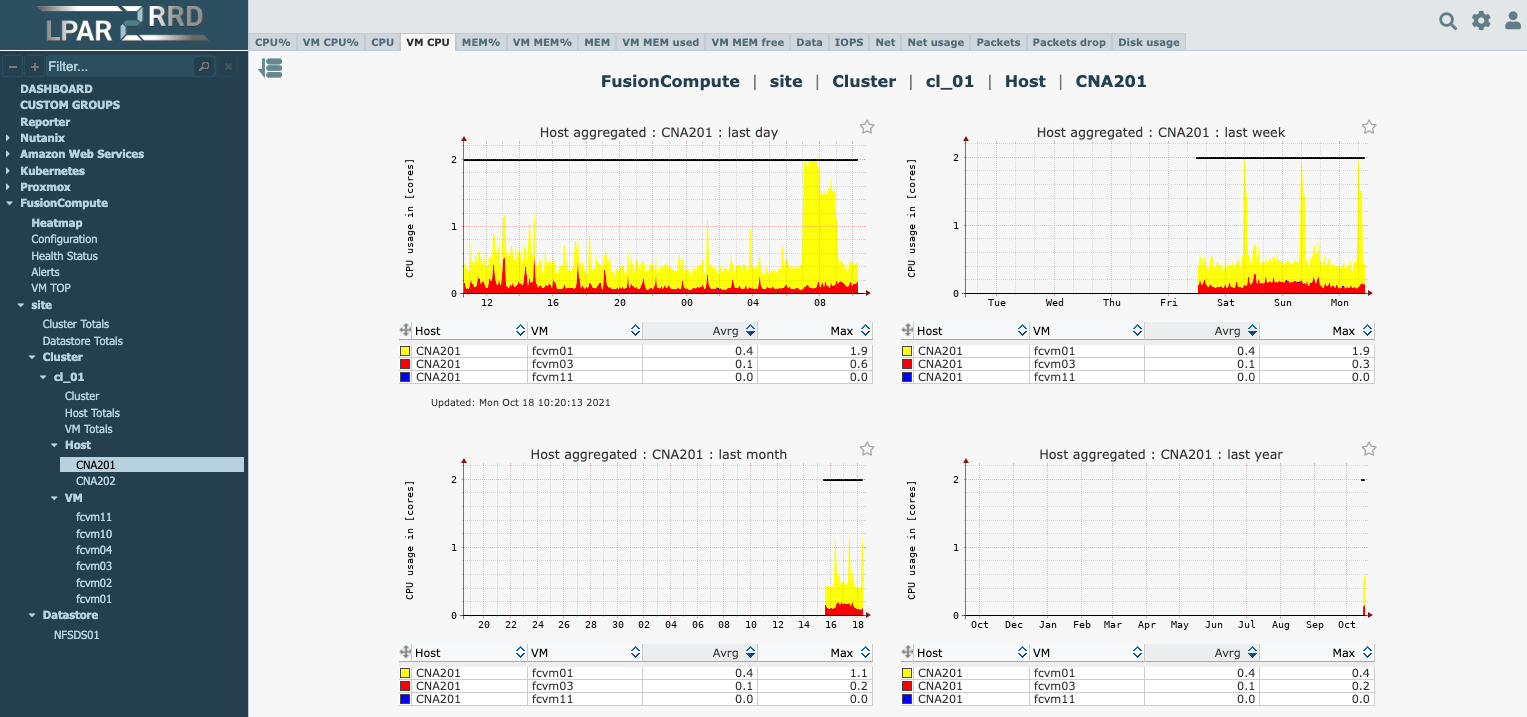 |
Datastore capacity 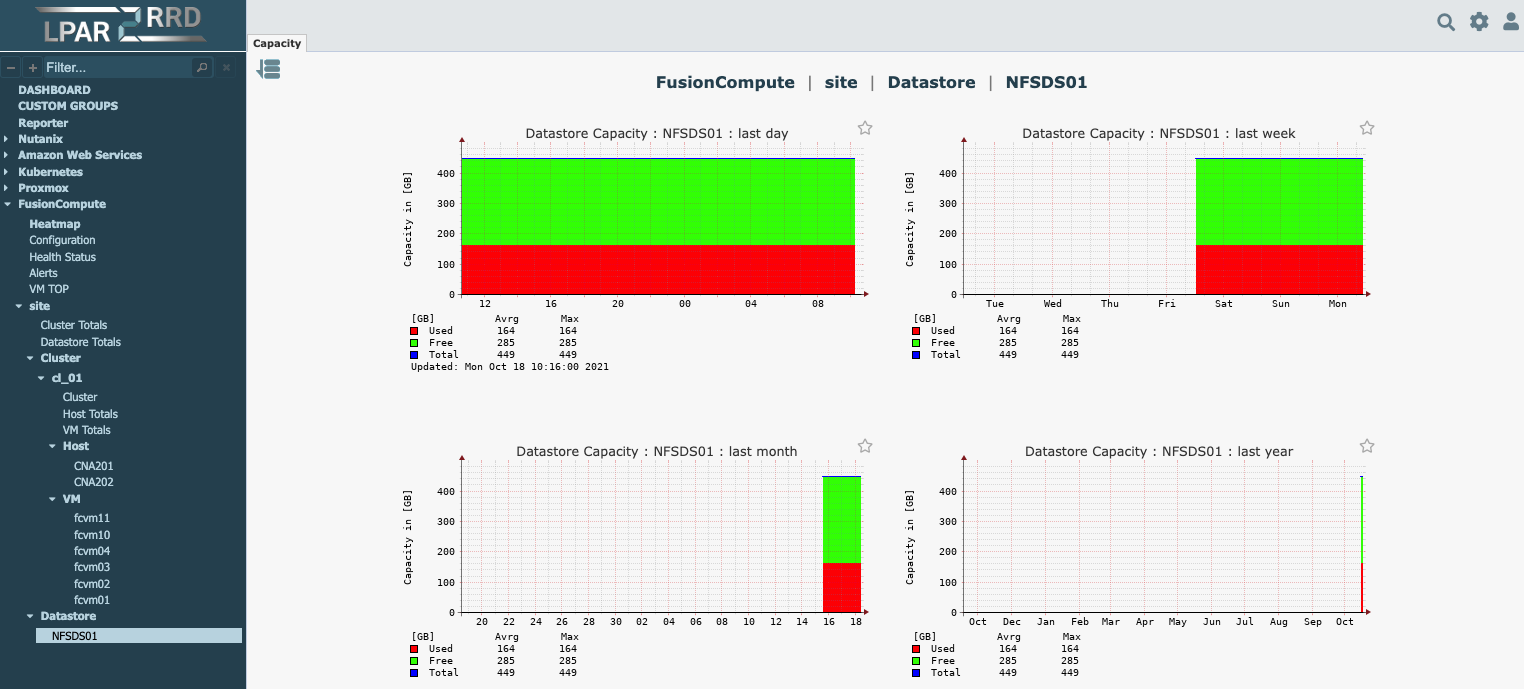 |
Collected Metrics
-
Node
- CPU %
- CPU
- Memory
- Pods
- Containers data per Node
- Containers IOPS per Node
- Pods net per Node
-
Project
- Pods CPU
- Containers CPU
- Pods Memory
- Containers memory
- Pods Net
- Containers data
- Containers IOPS
-
Pod
- CPU
- Containers CPU per Pod
- Memory
- Containers memory per Pod
- Network
- Containers data per Pod
- Containers IOPS per Pod
-
Container
- CPU
- Memory
- Data
- IOPS
You can see implementation on Free Demo
Examples
Configuration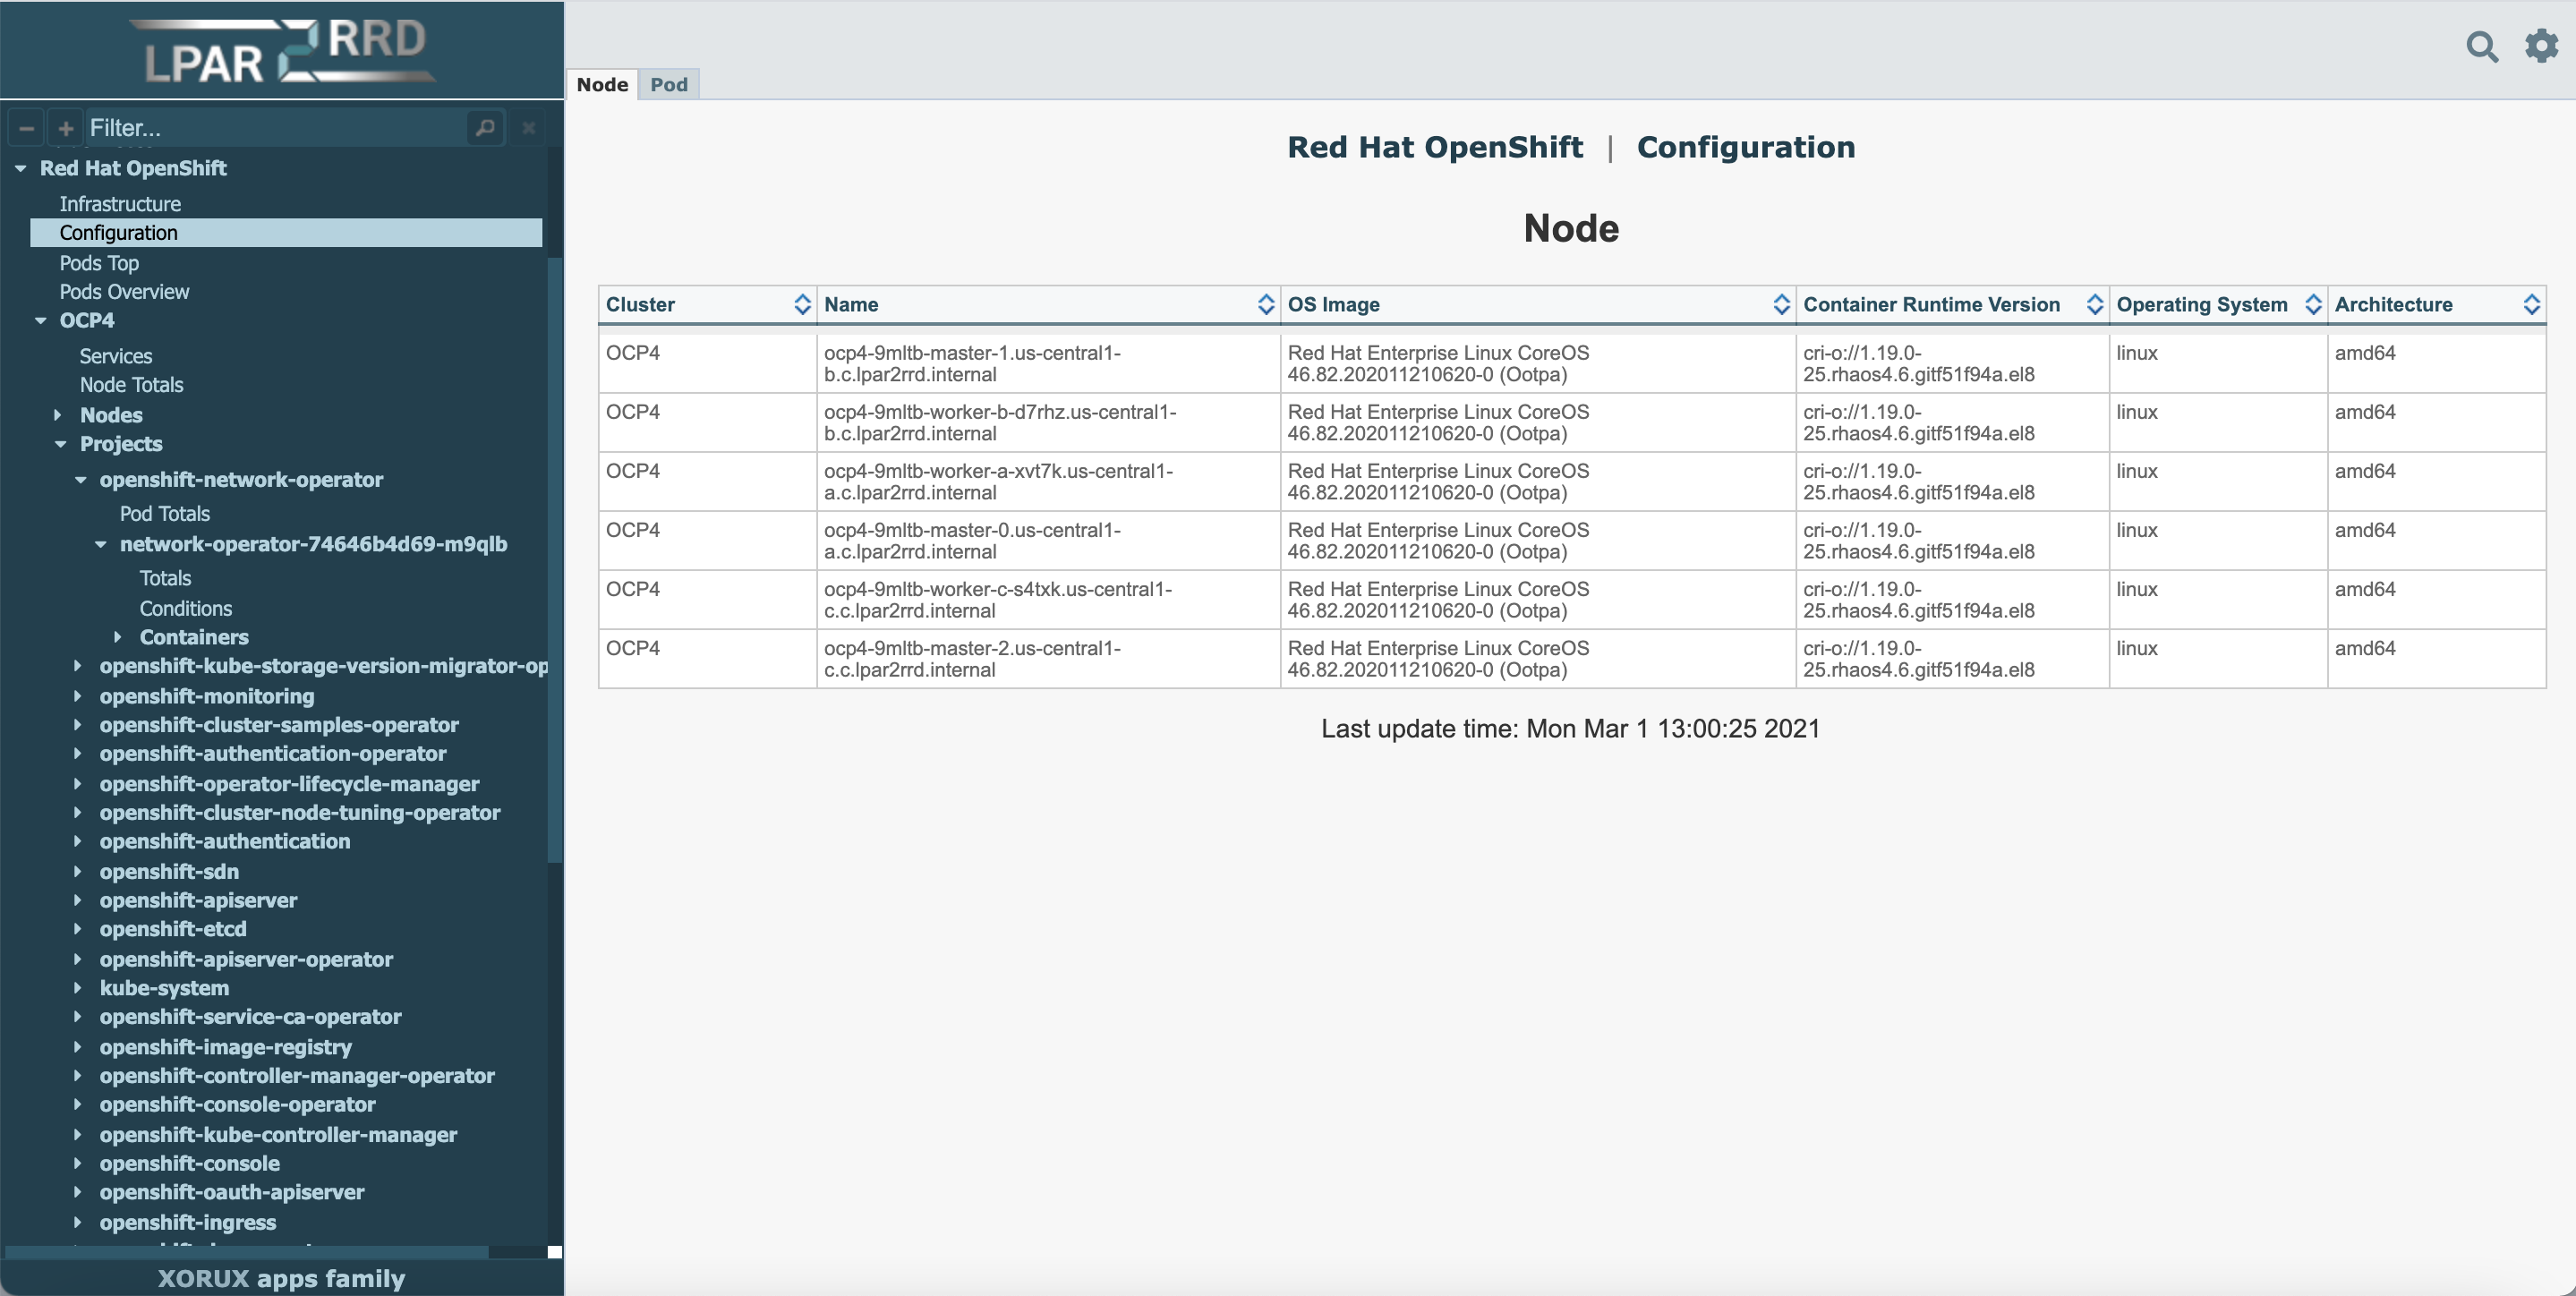 |
Memory container 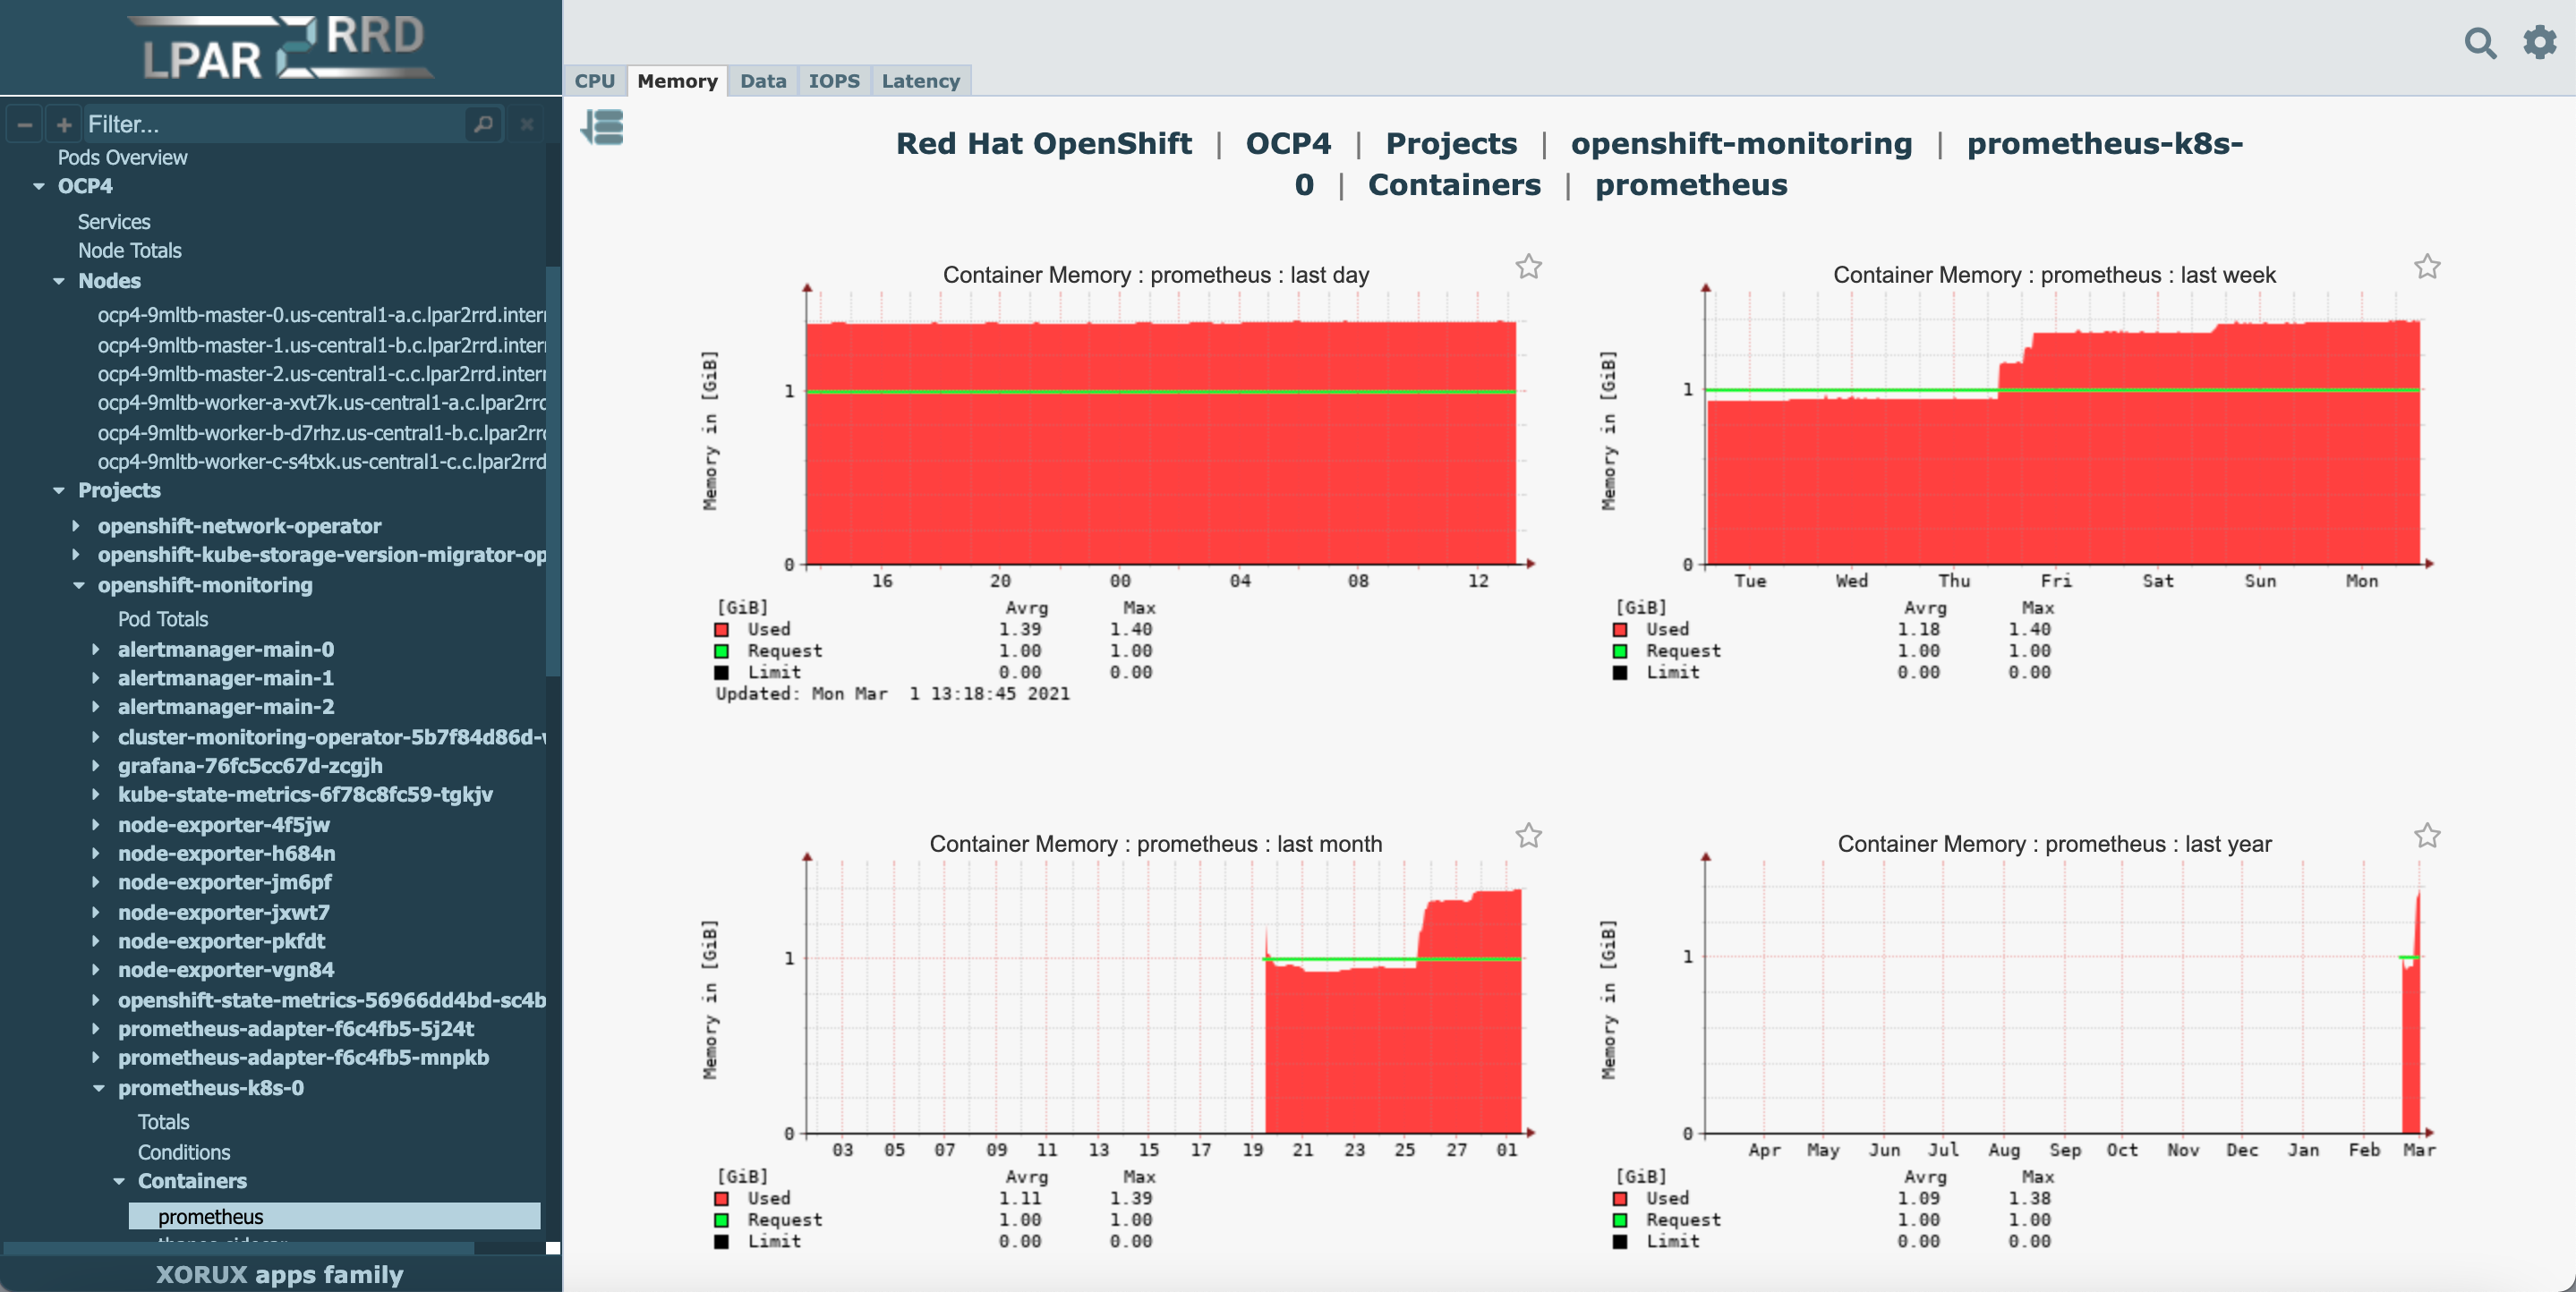 |
Node CPU aggregation 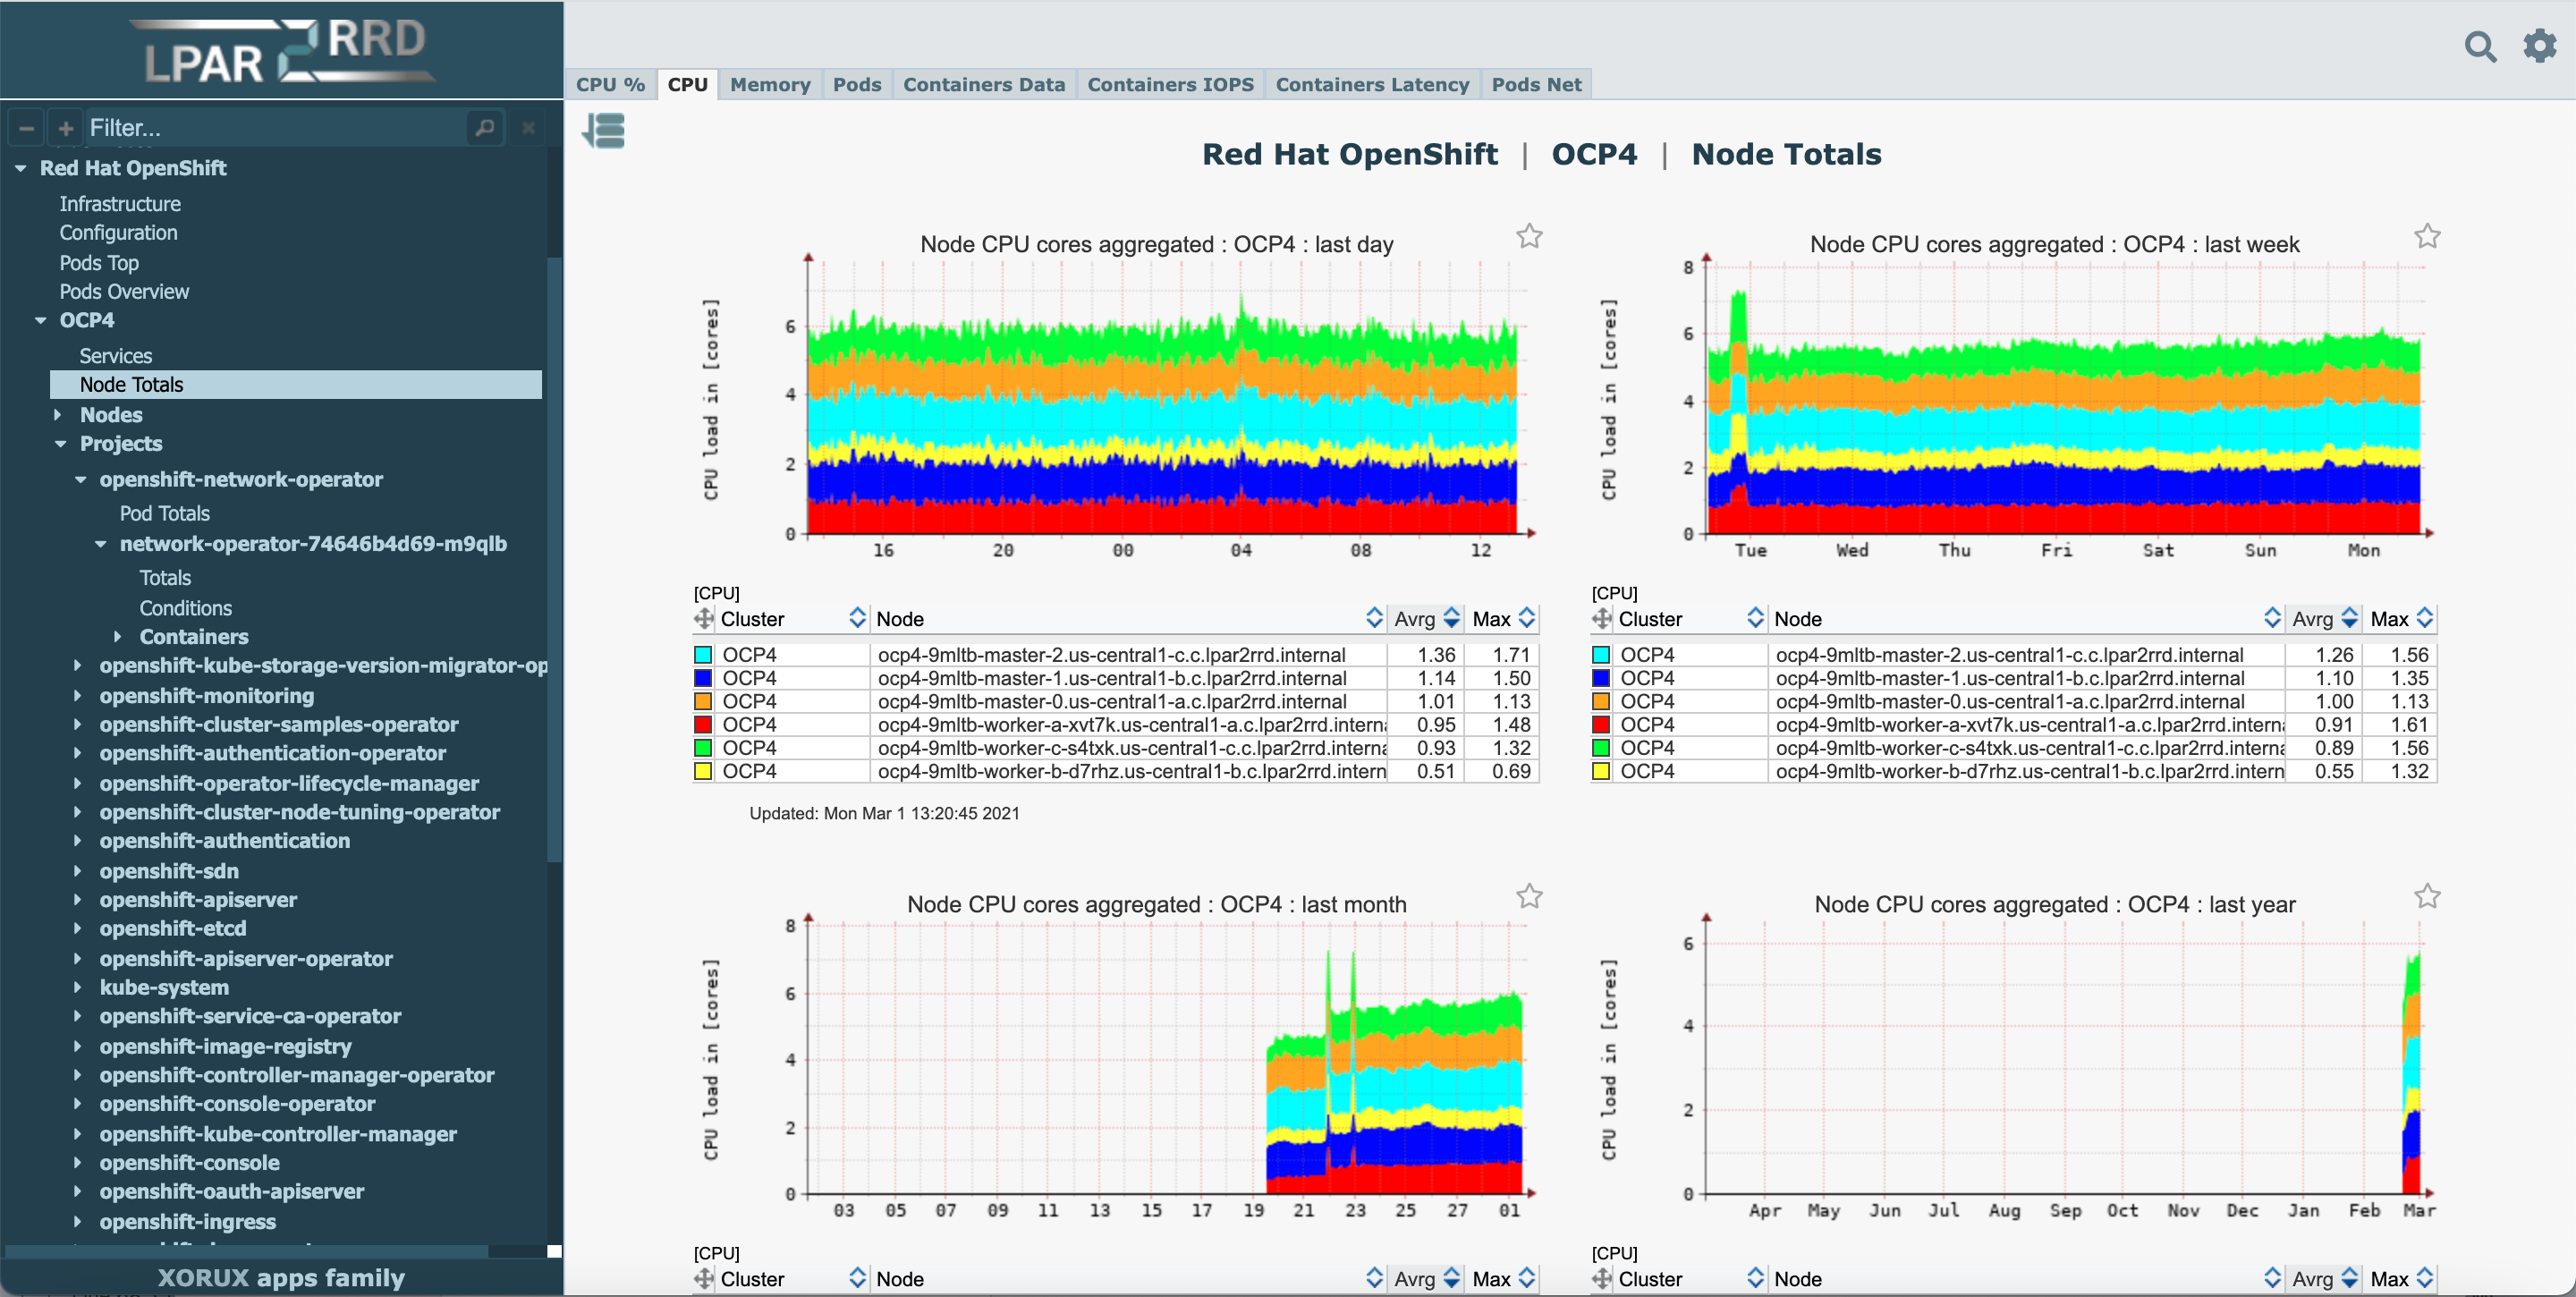 |
Pods net per Node 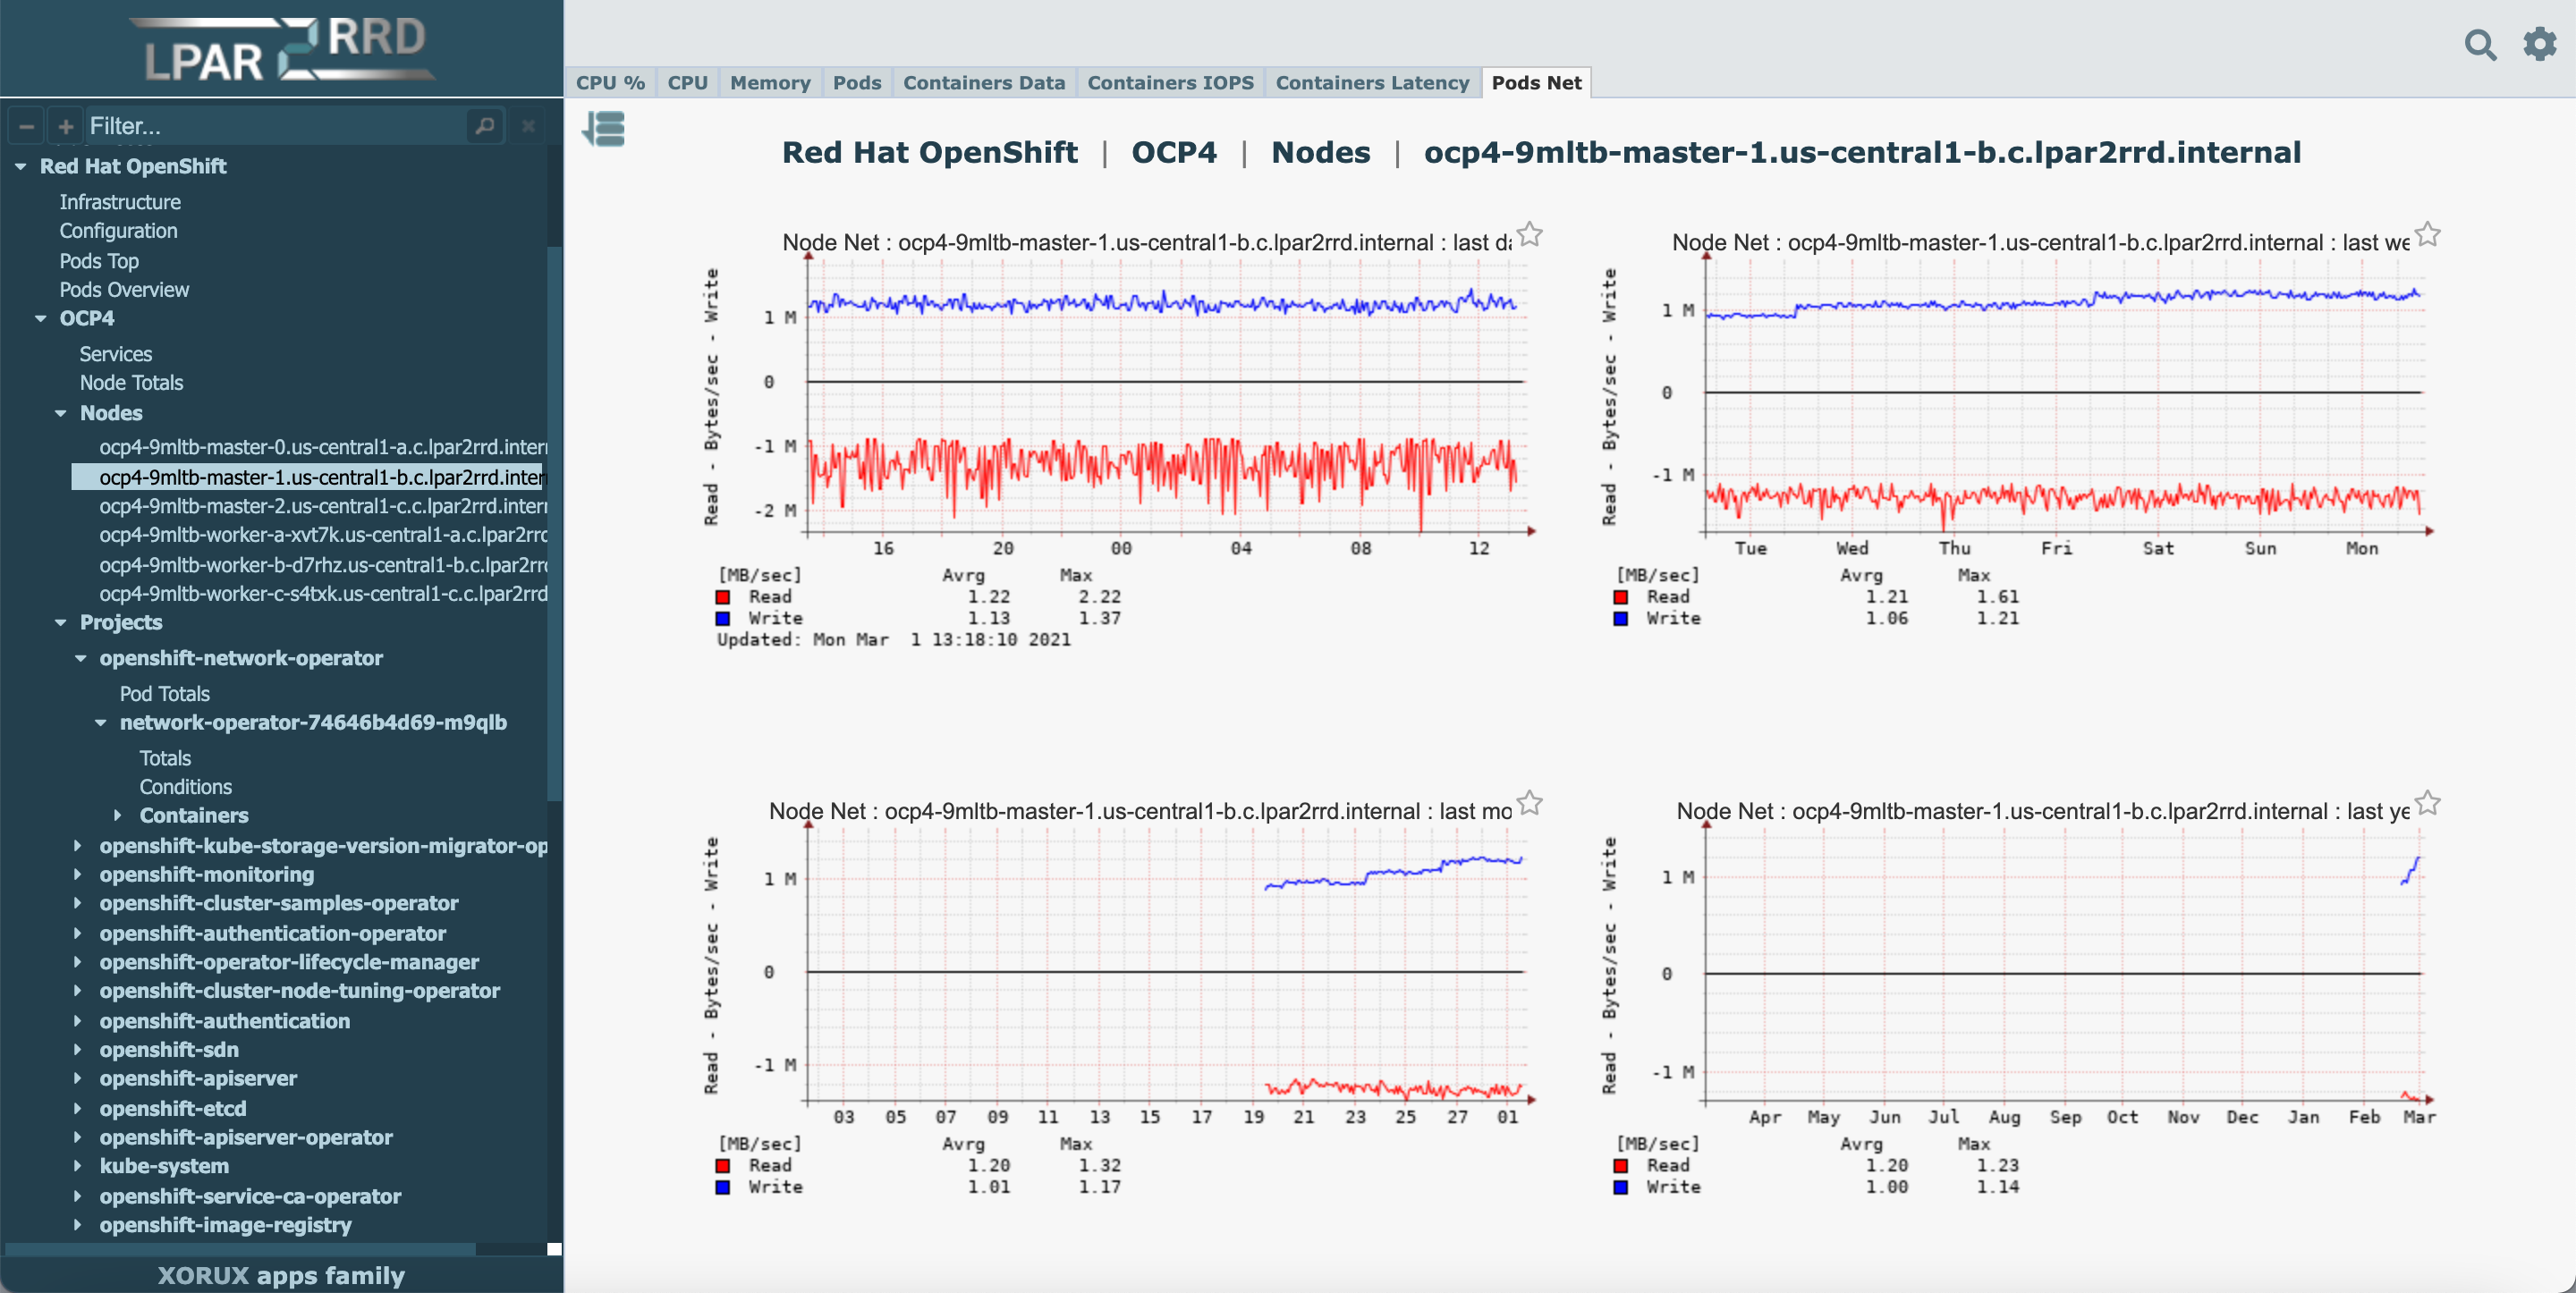 |
CPU containers per Project 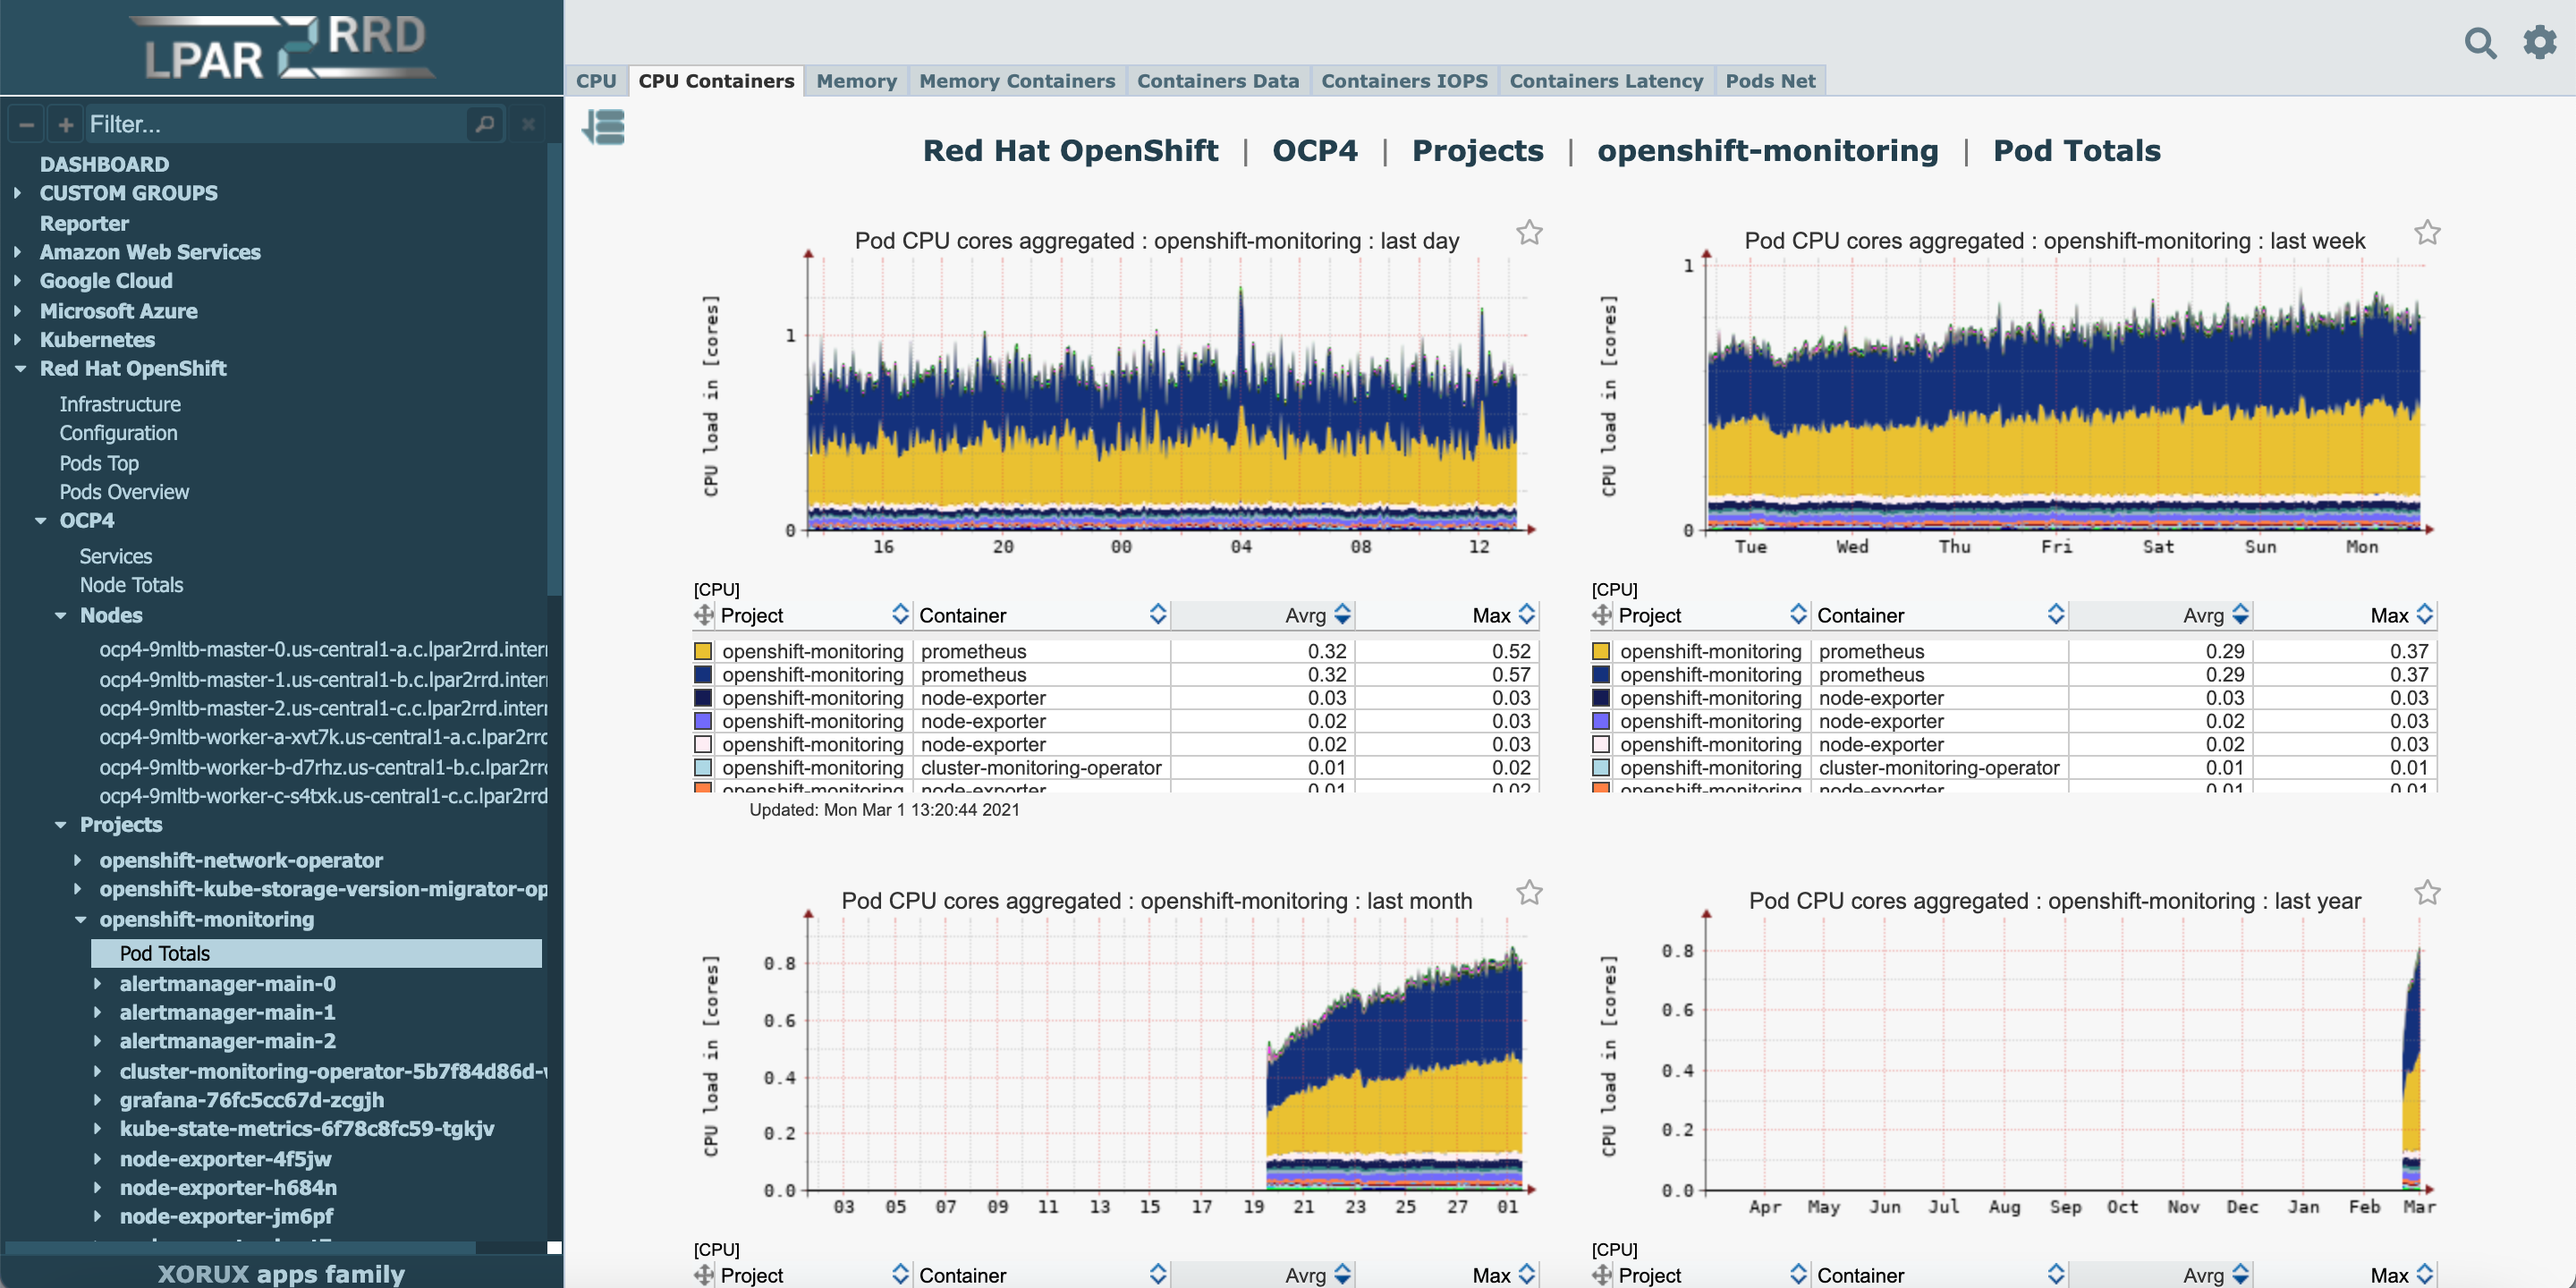 |
Collected Metrics
-
Container
- CPU %
- CPU
- Memory usage
- Data
- IOPS
- Net
- Size
- Size RW
-
Volume
- Size
You can see implementation on Free Demo
Examples
Container CPU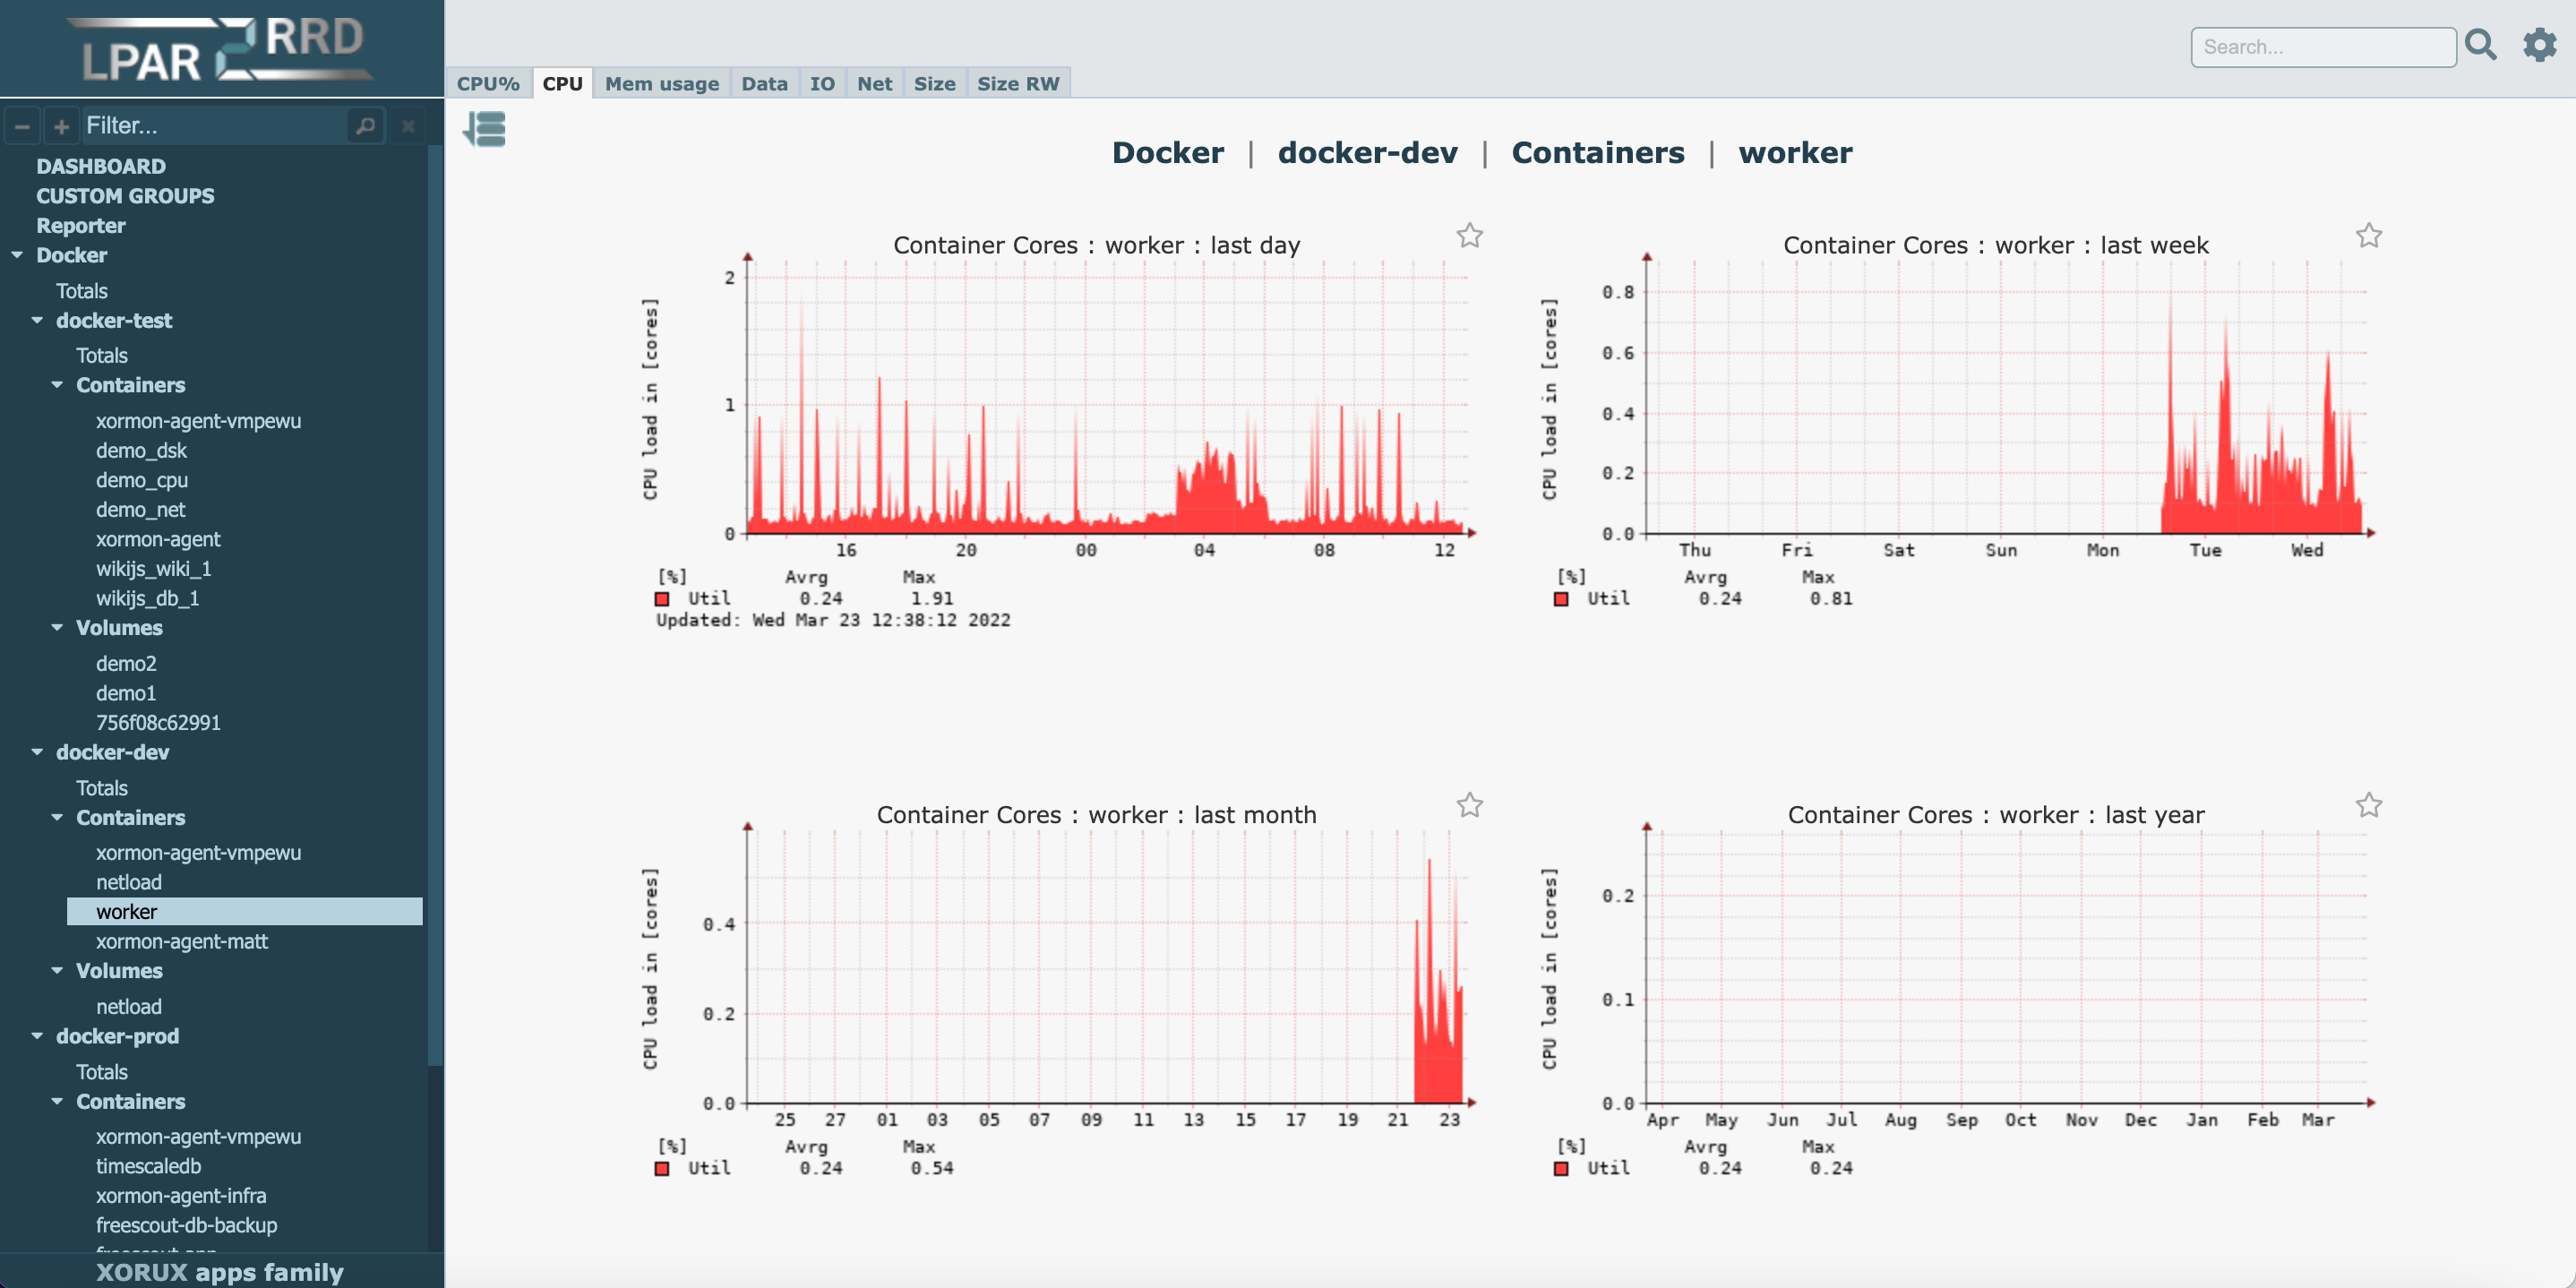 |
Container Net 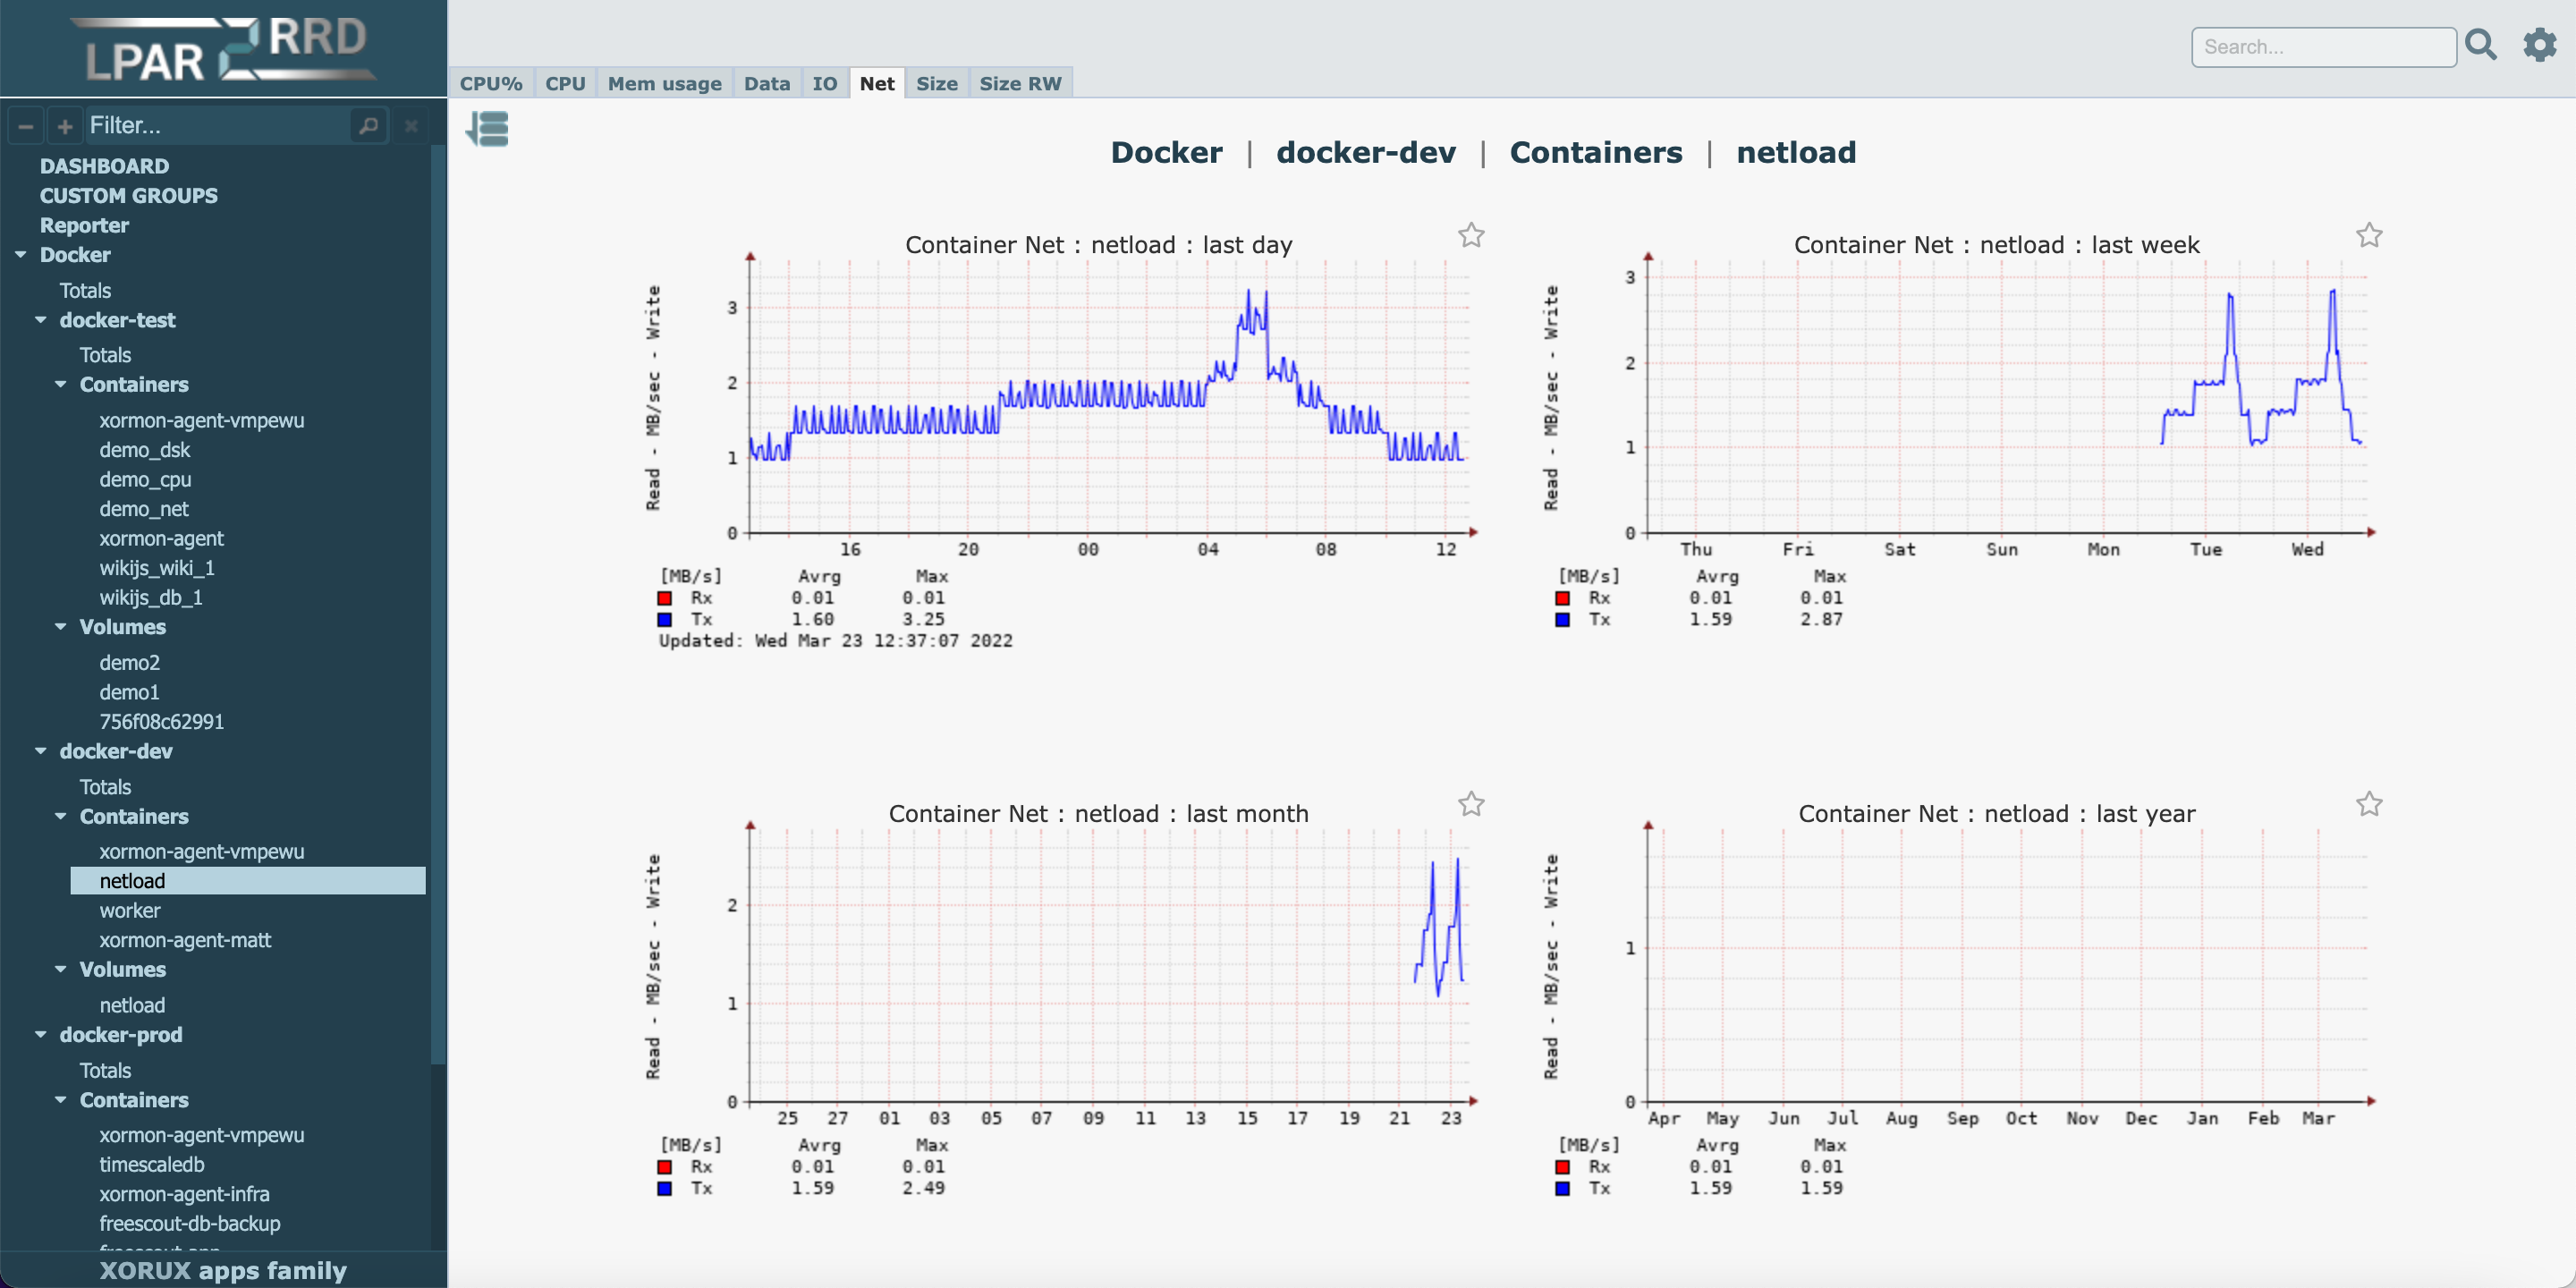 |
Volume Size 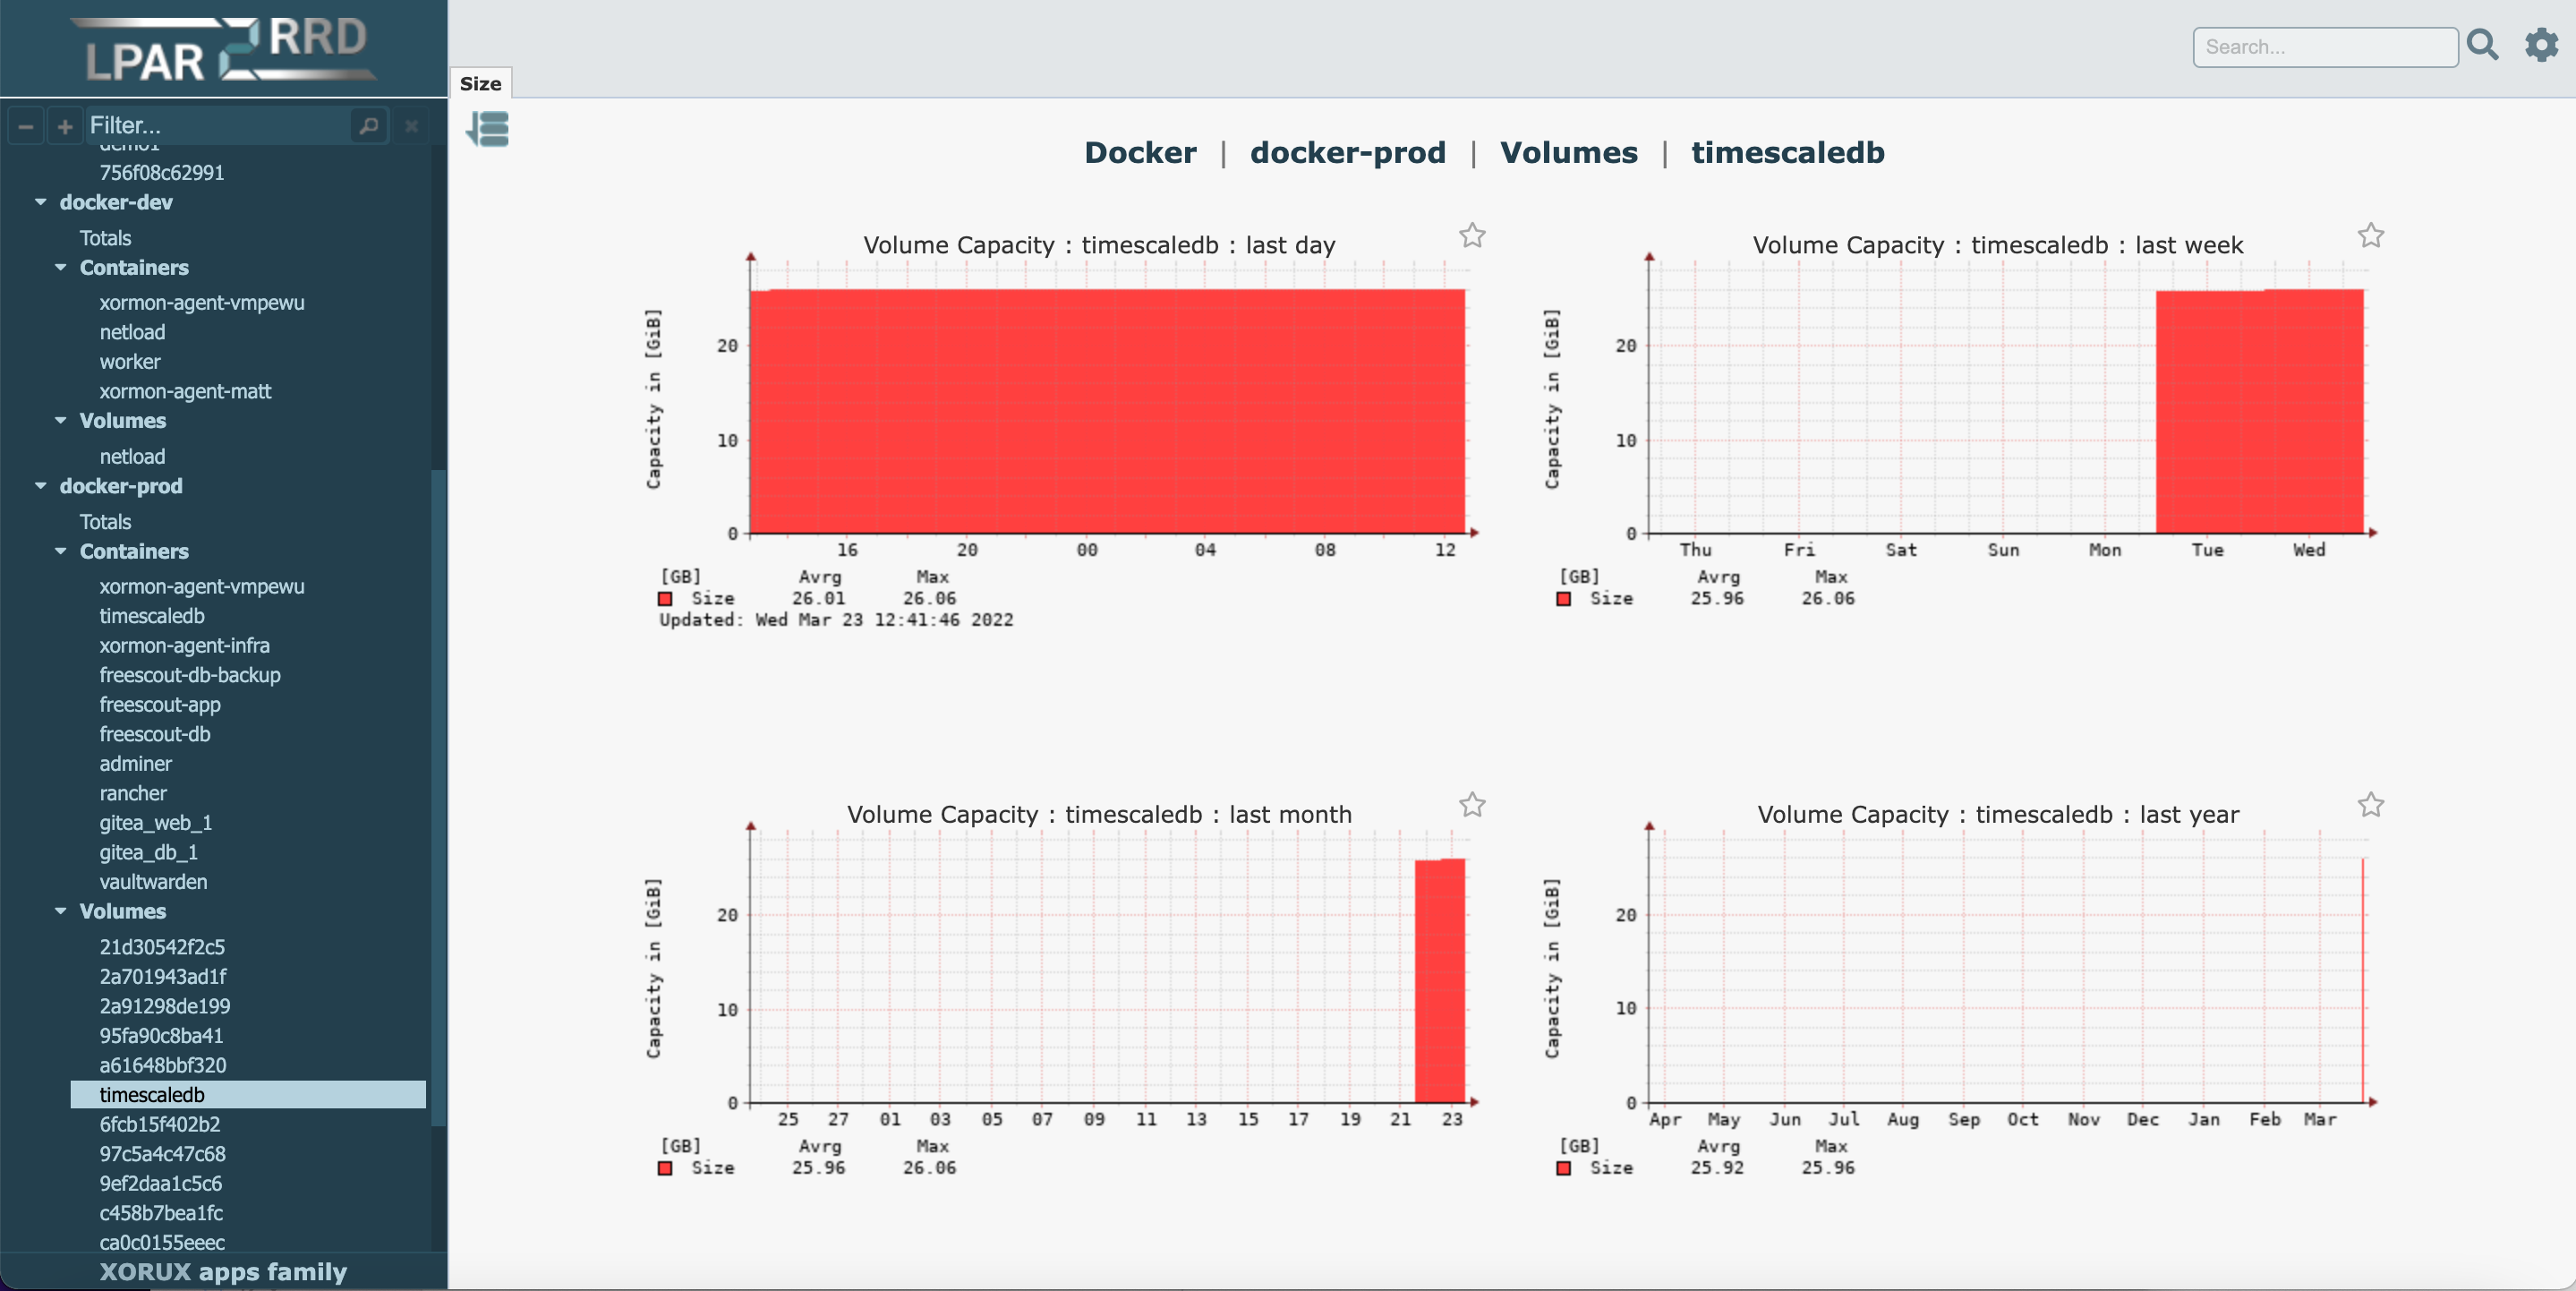 |
Container Data aggr 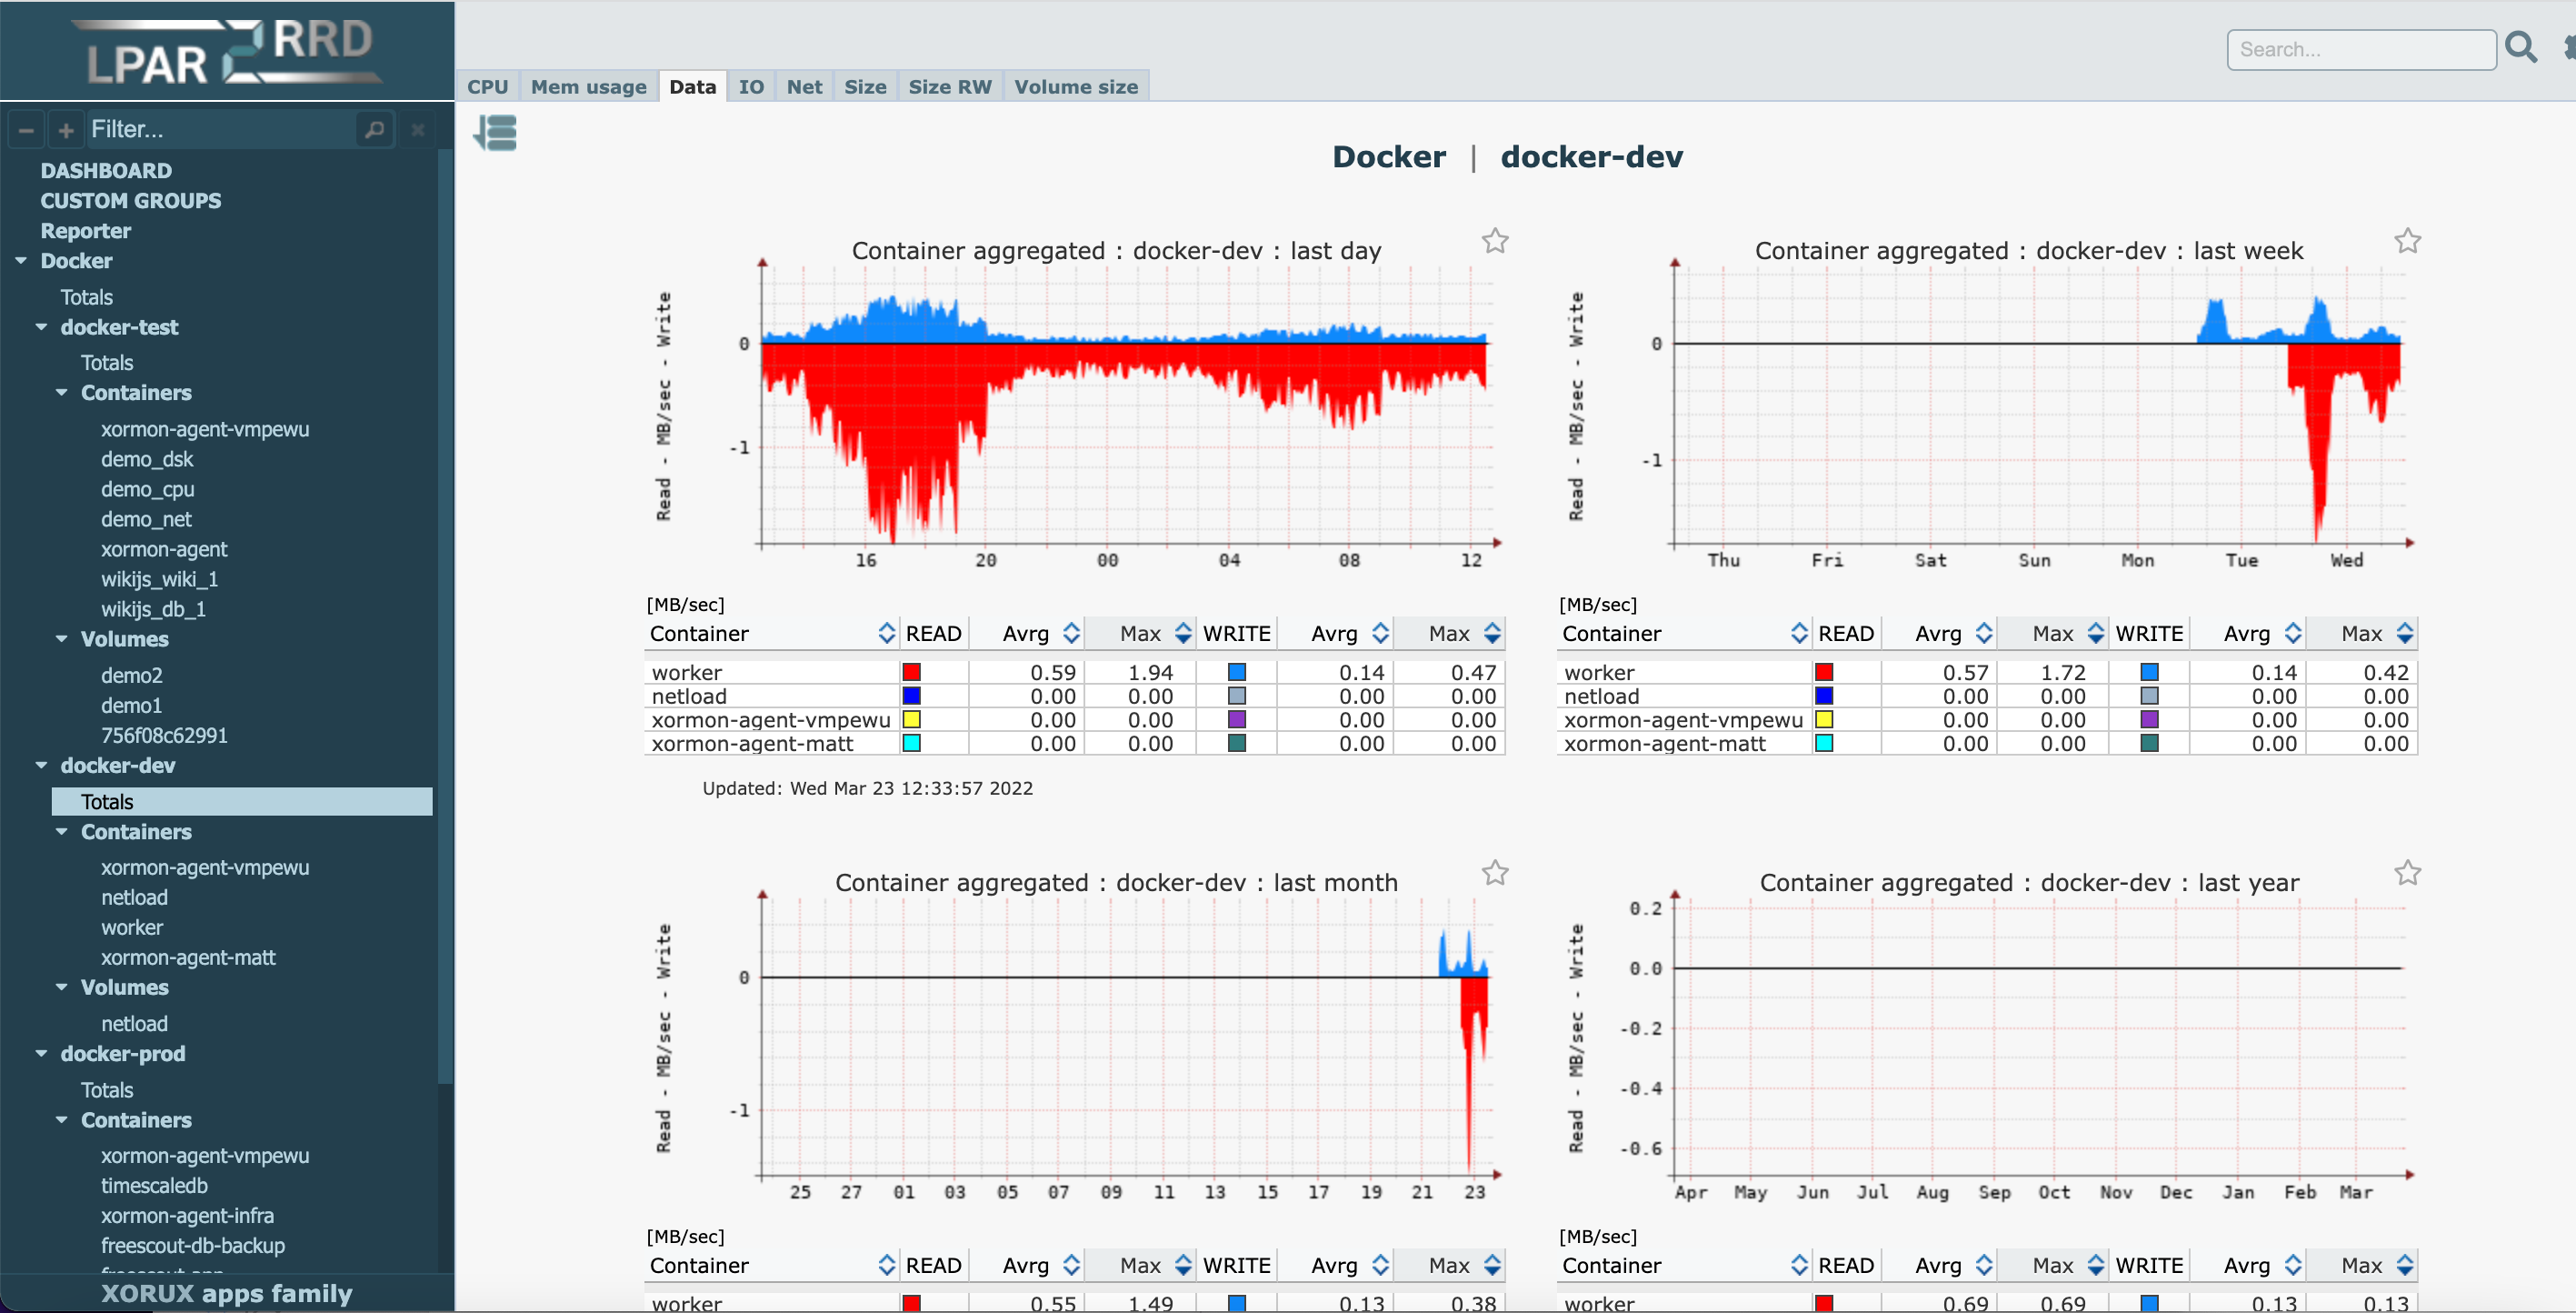 |
Container Memory usage aggr 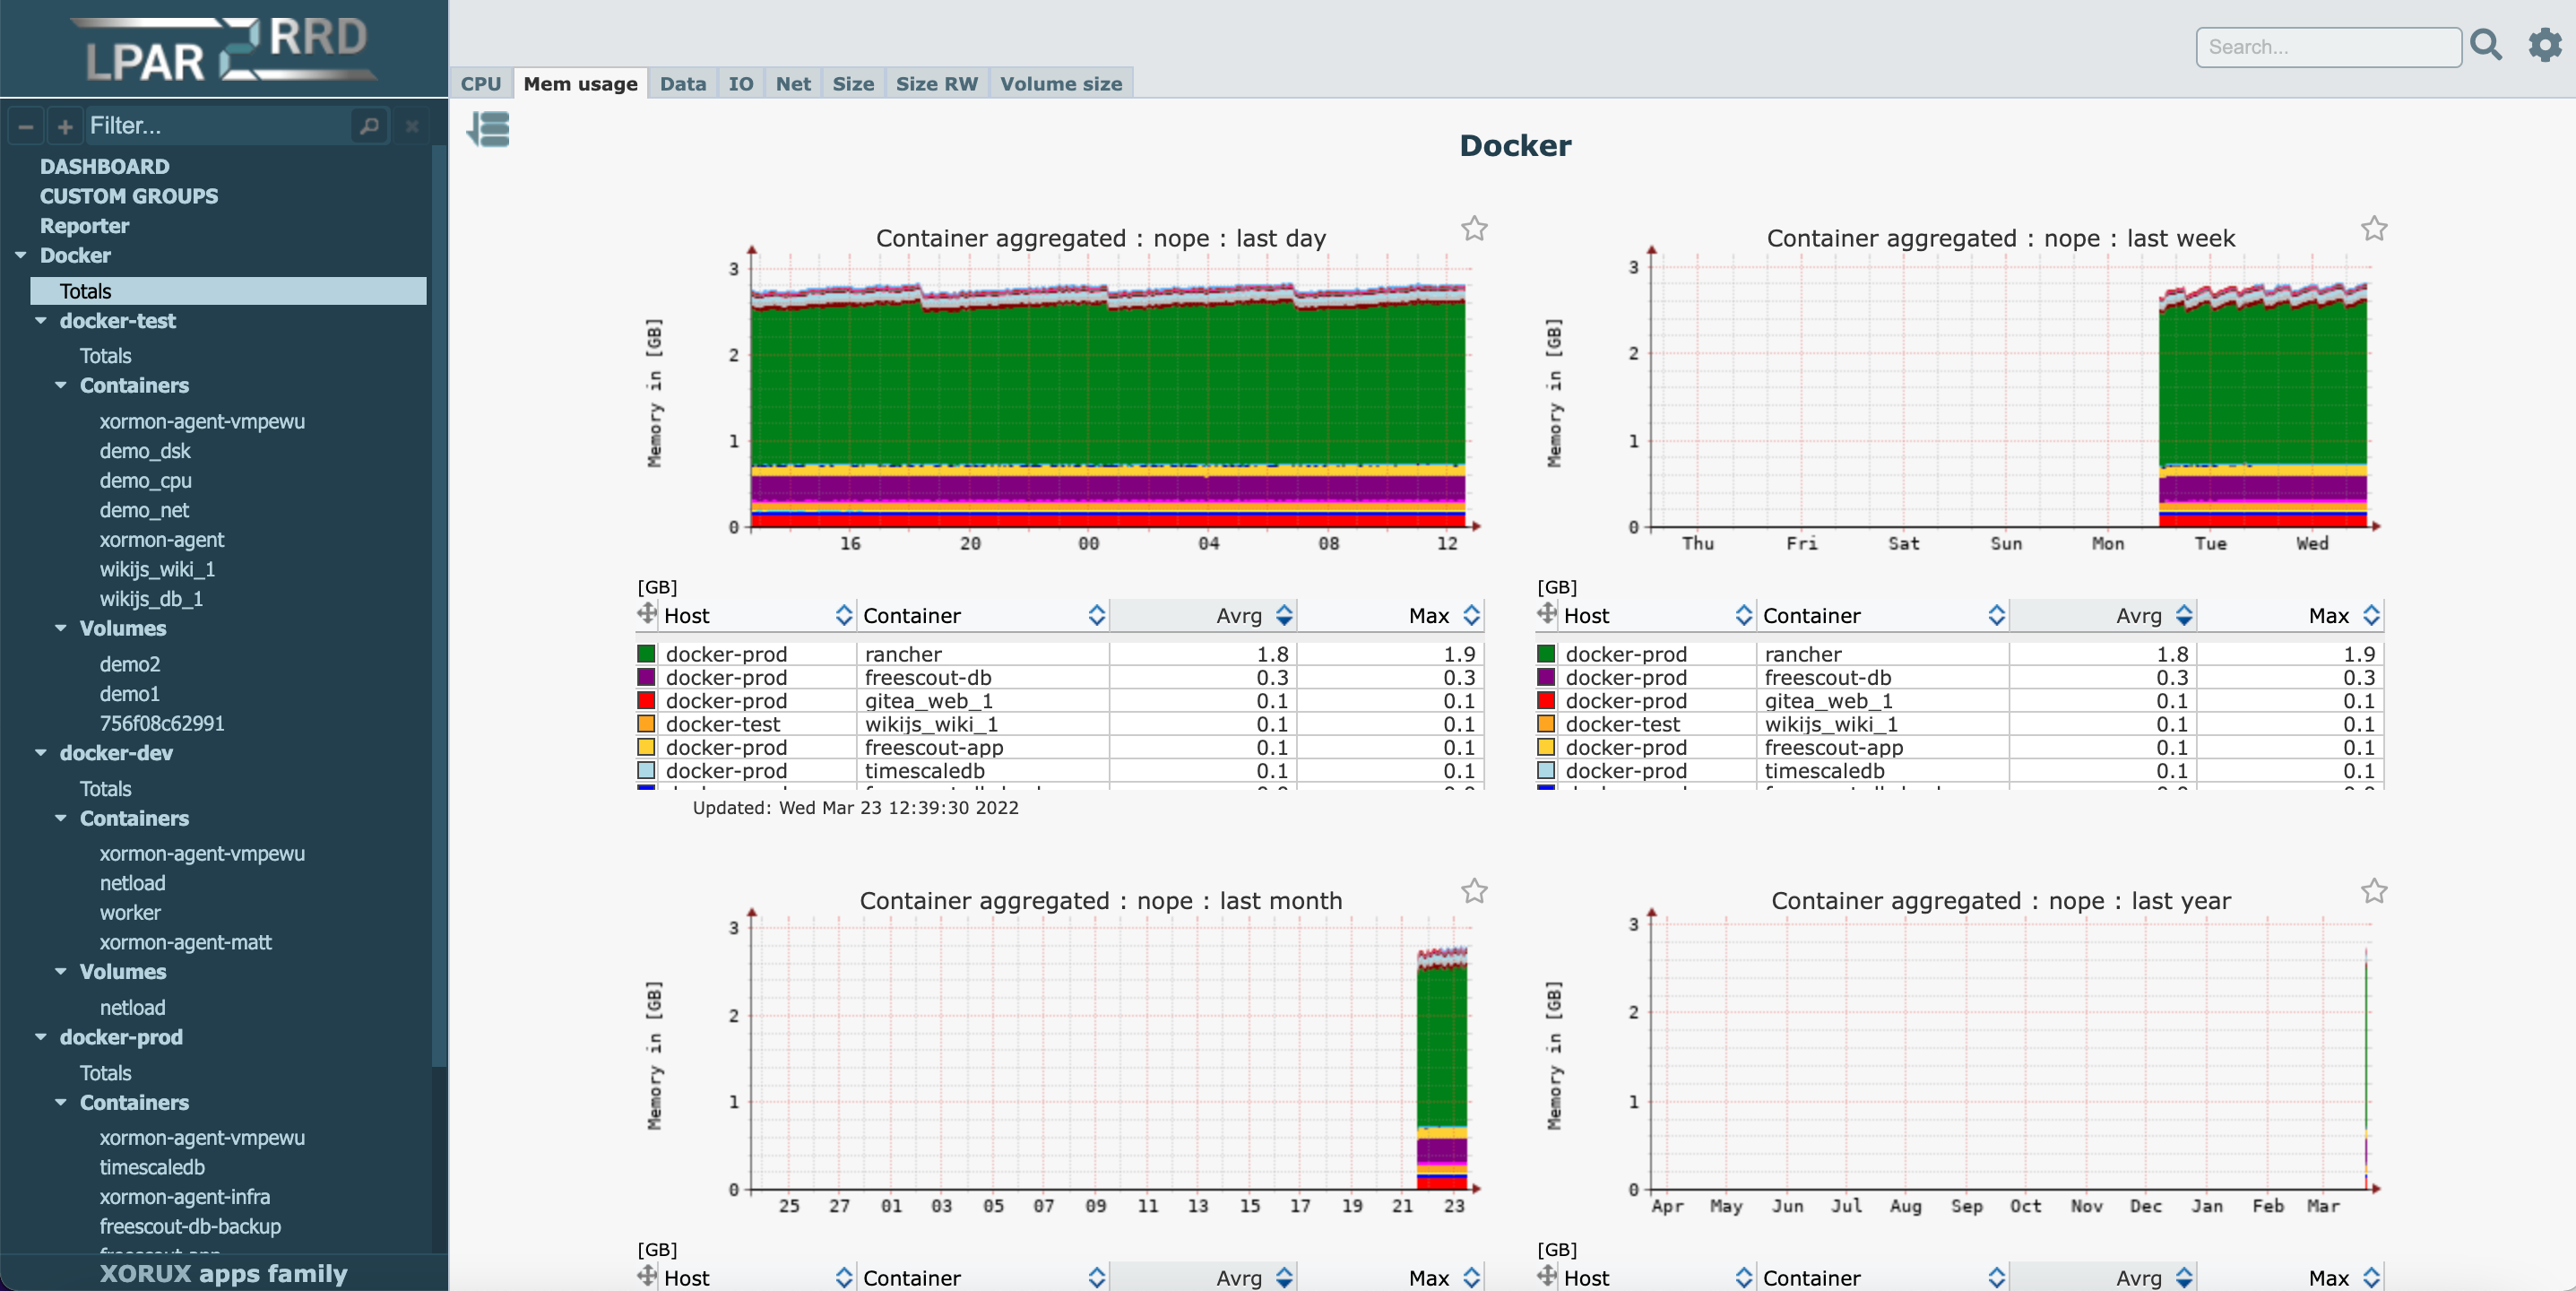 |
Volume Size aggr 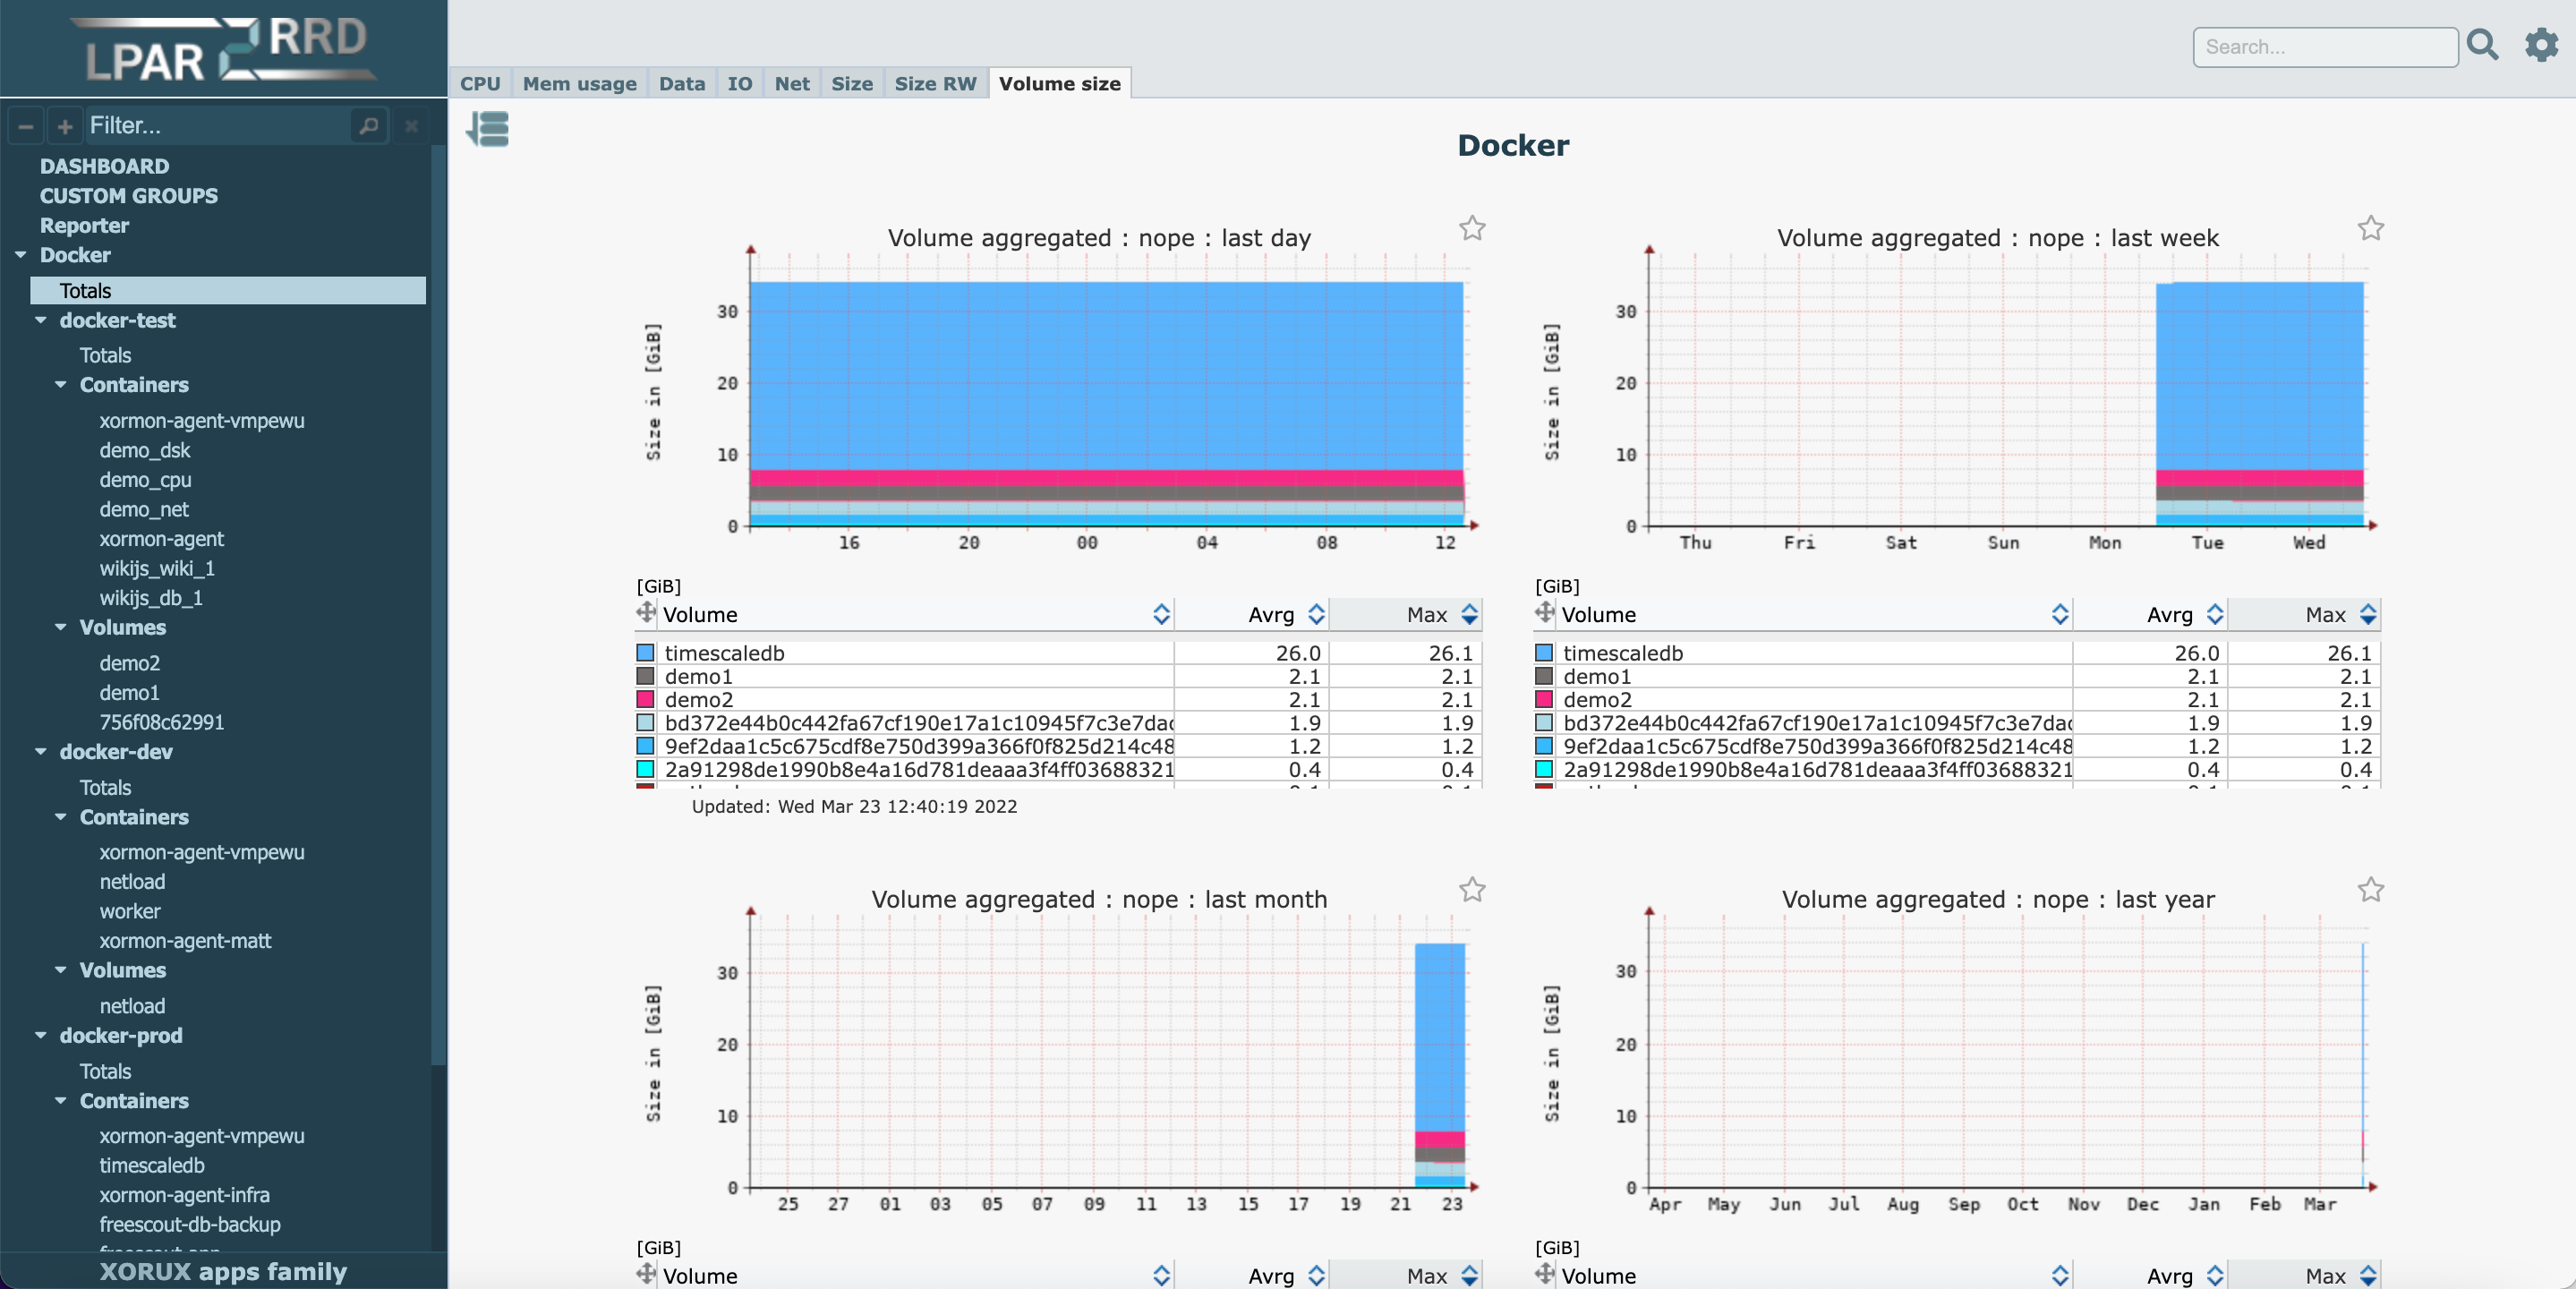 |
Collected Metrics
-
Node
- CPU %
- CPU
- Memory
- Pods
- Containers data per Node
- Containers IOPS per Node
- Pods net per Node
-
Pod
- CPU
- Containers CPU per Pod
- Memory
- Containers memory per Pod
- Network
- Containers data per Pod
- Containers IOPS per Pod
-
Container
- CPU
- Memory
- Data
- IOPS
You can see implementation on Free Demo
Examples
Configuration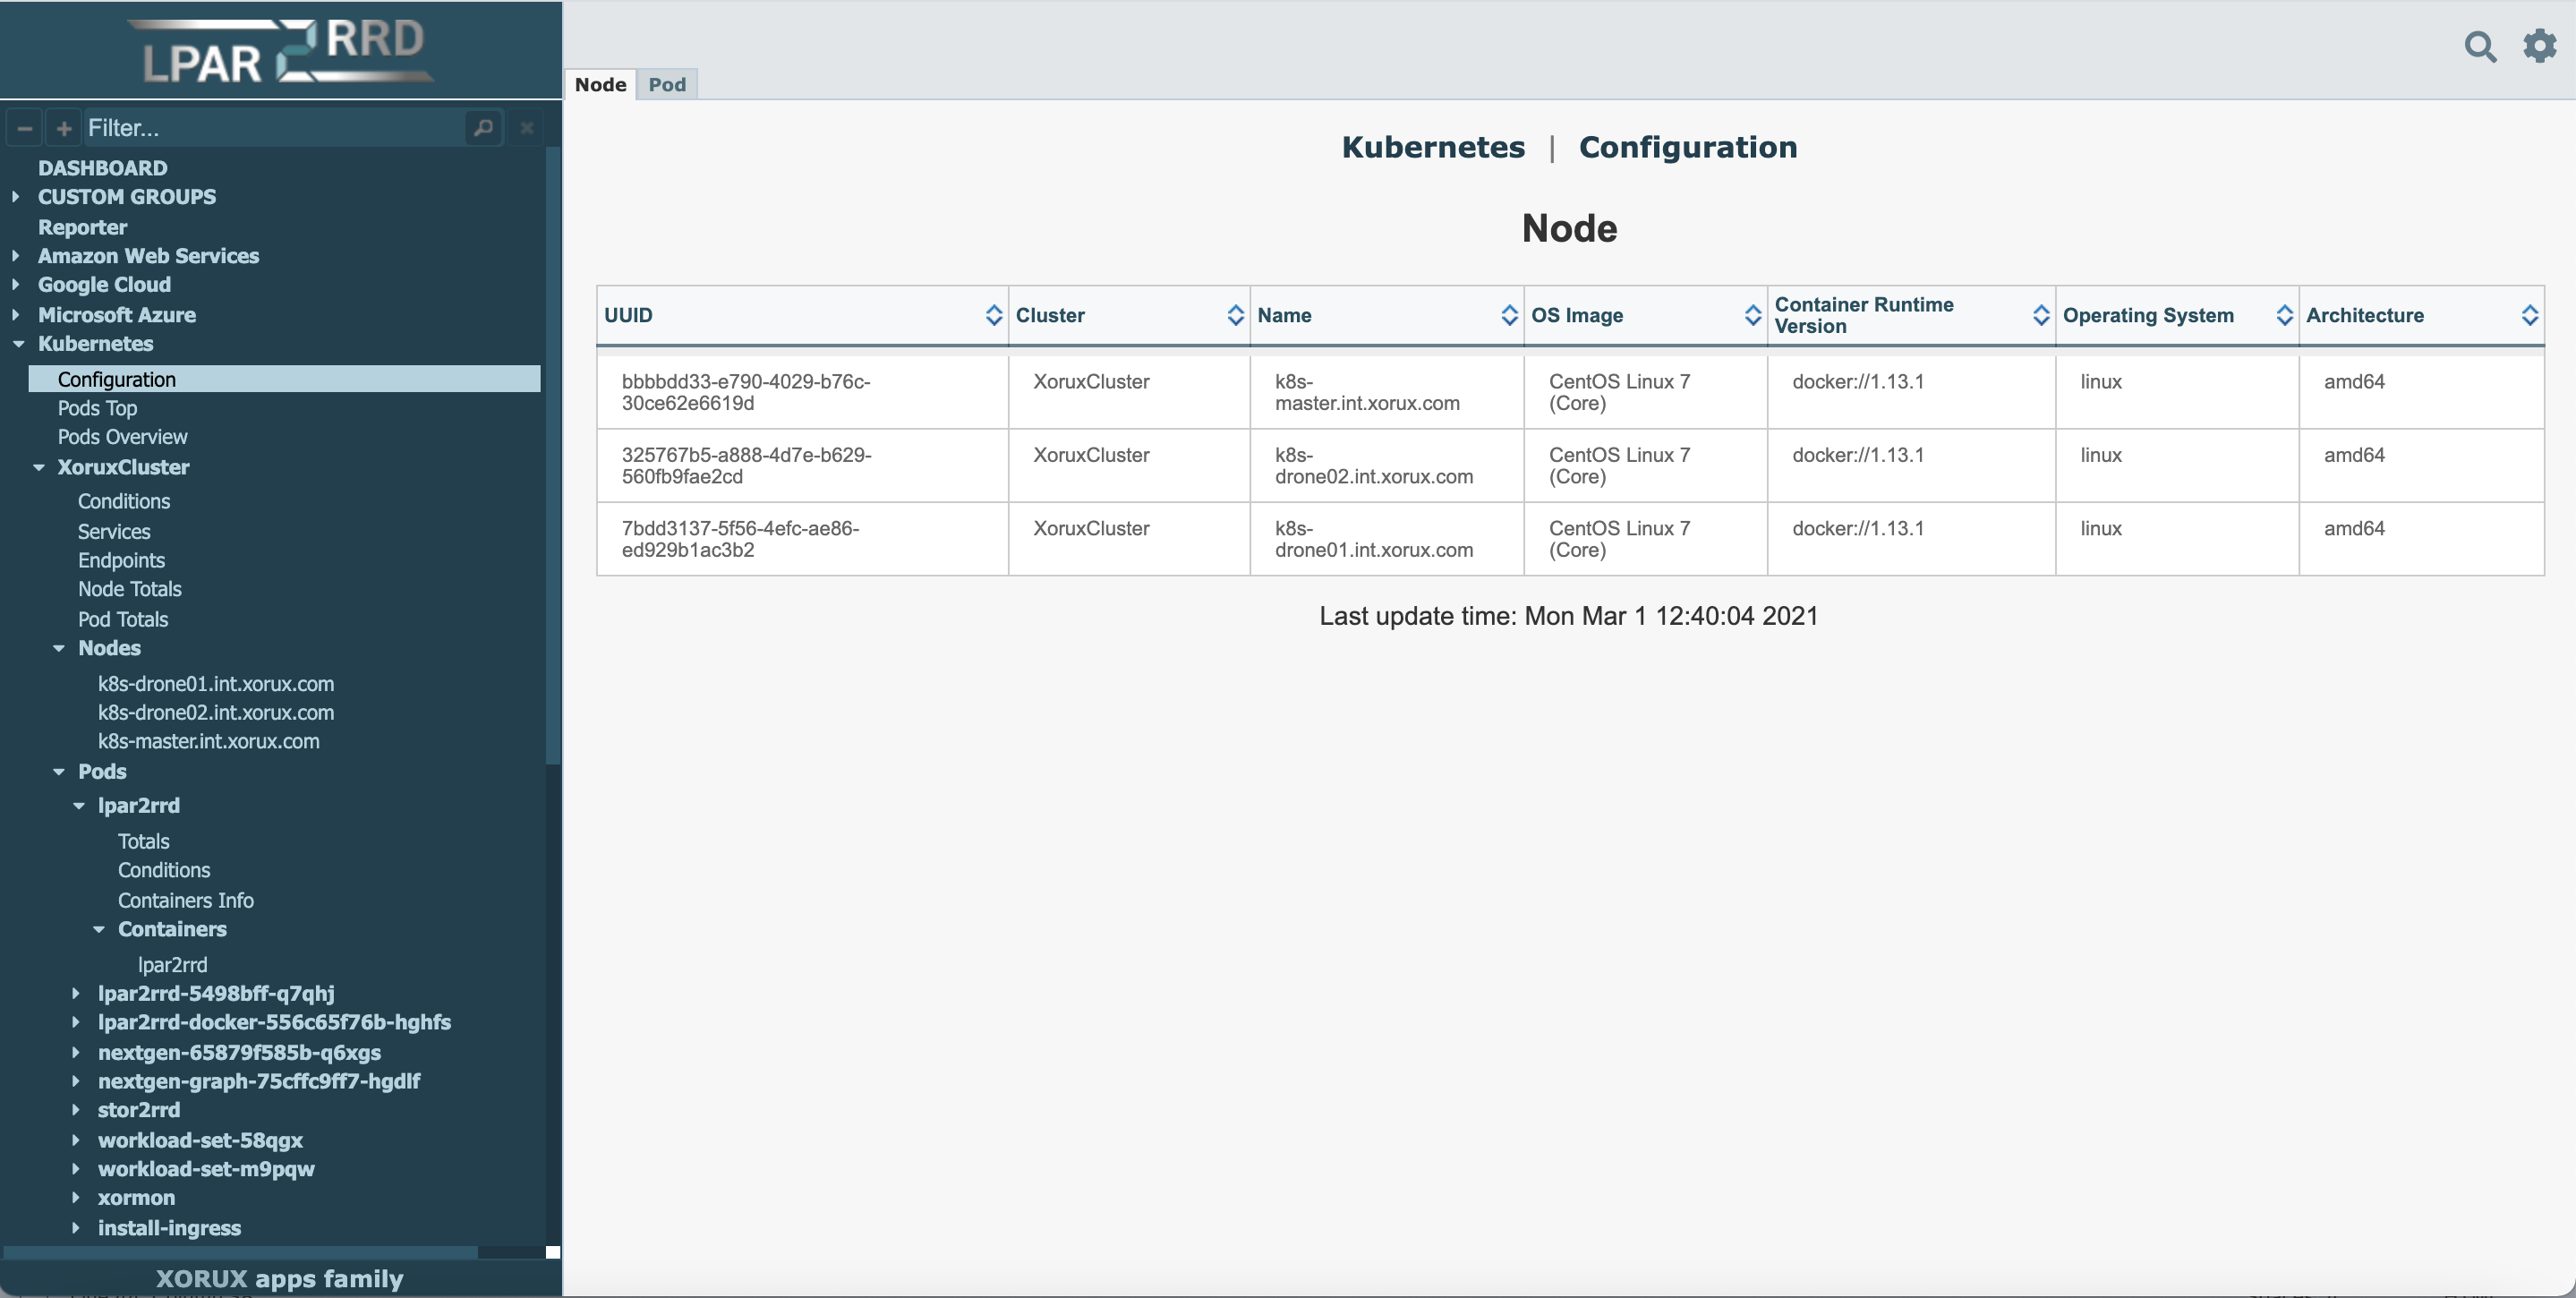 |
CPU Containers 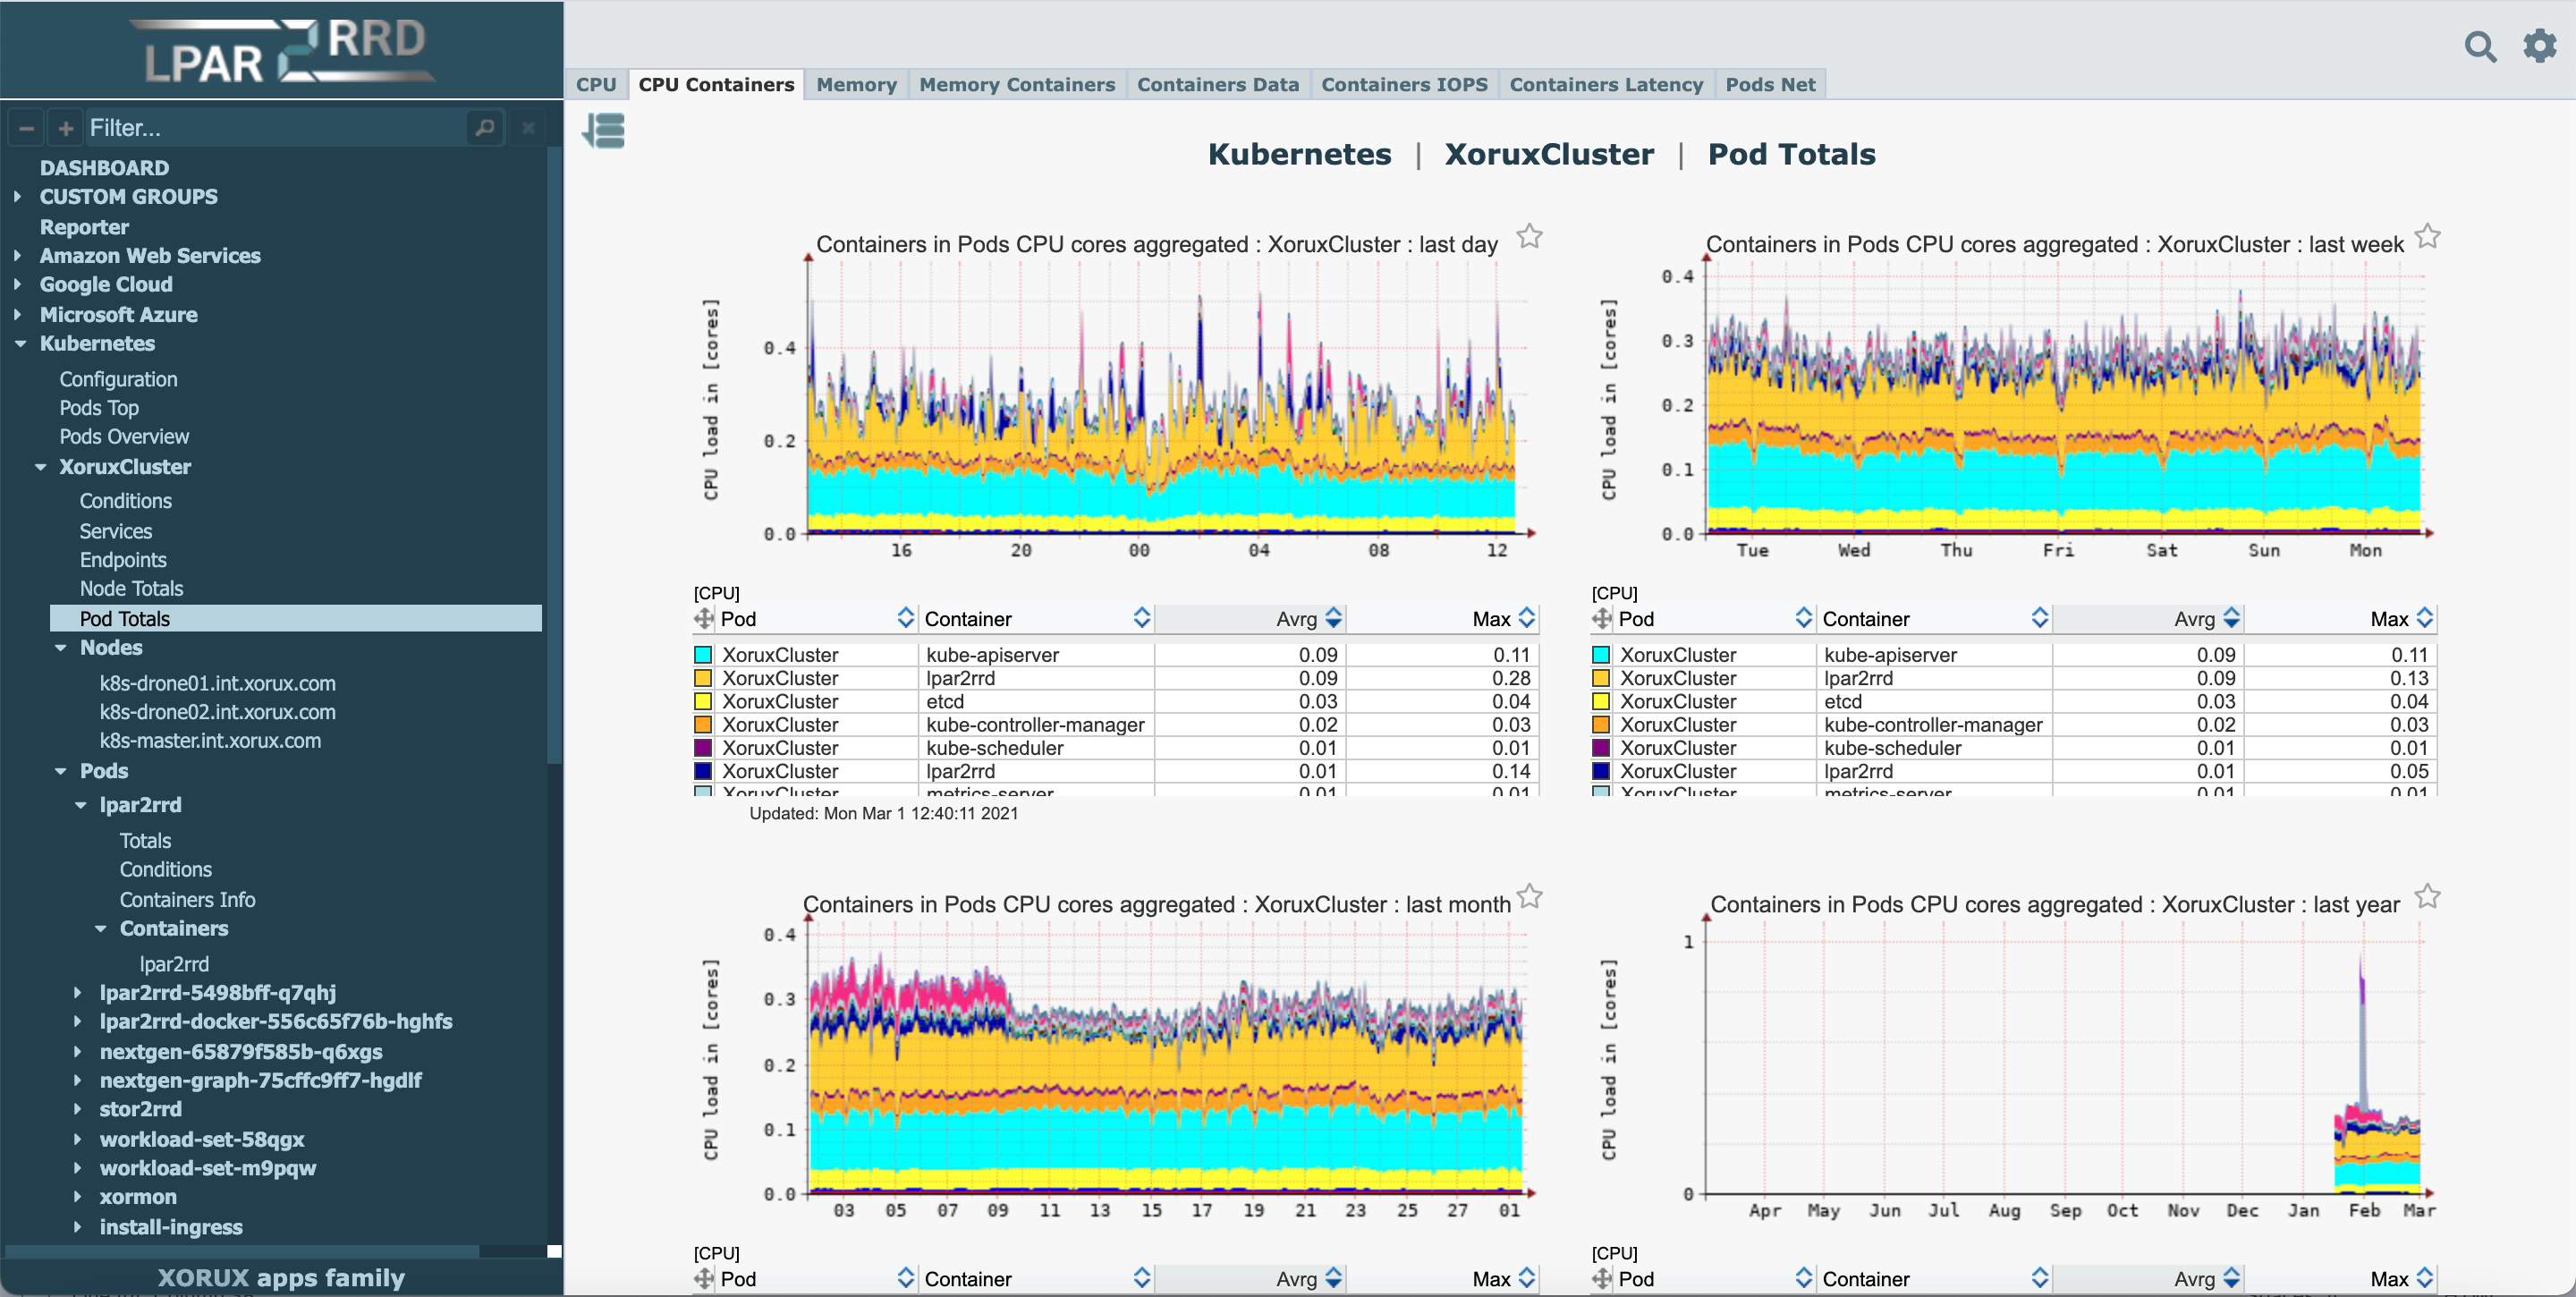 |
Containers data per Node 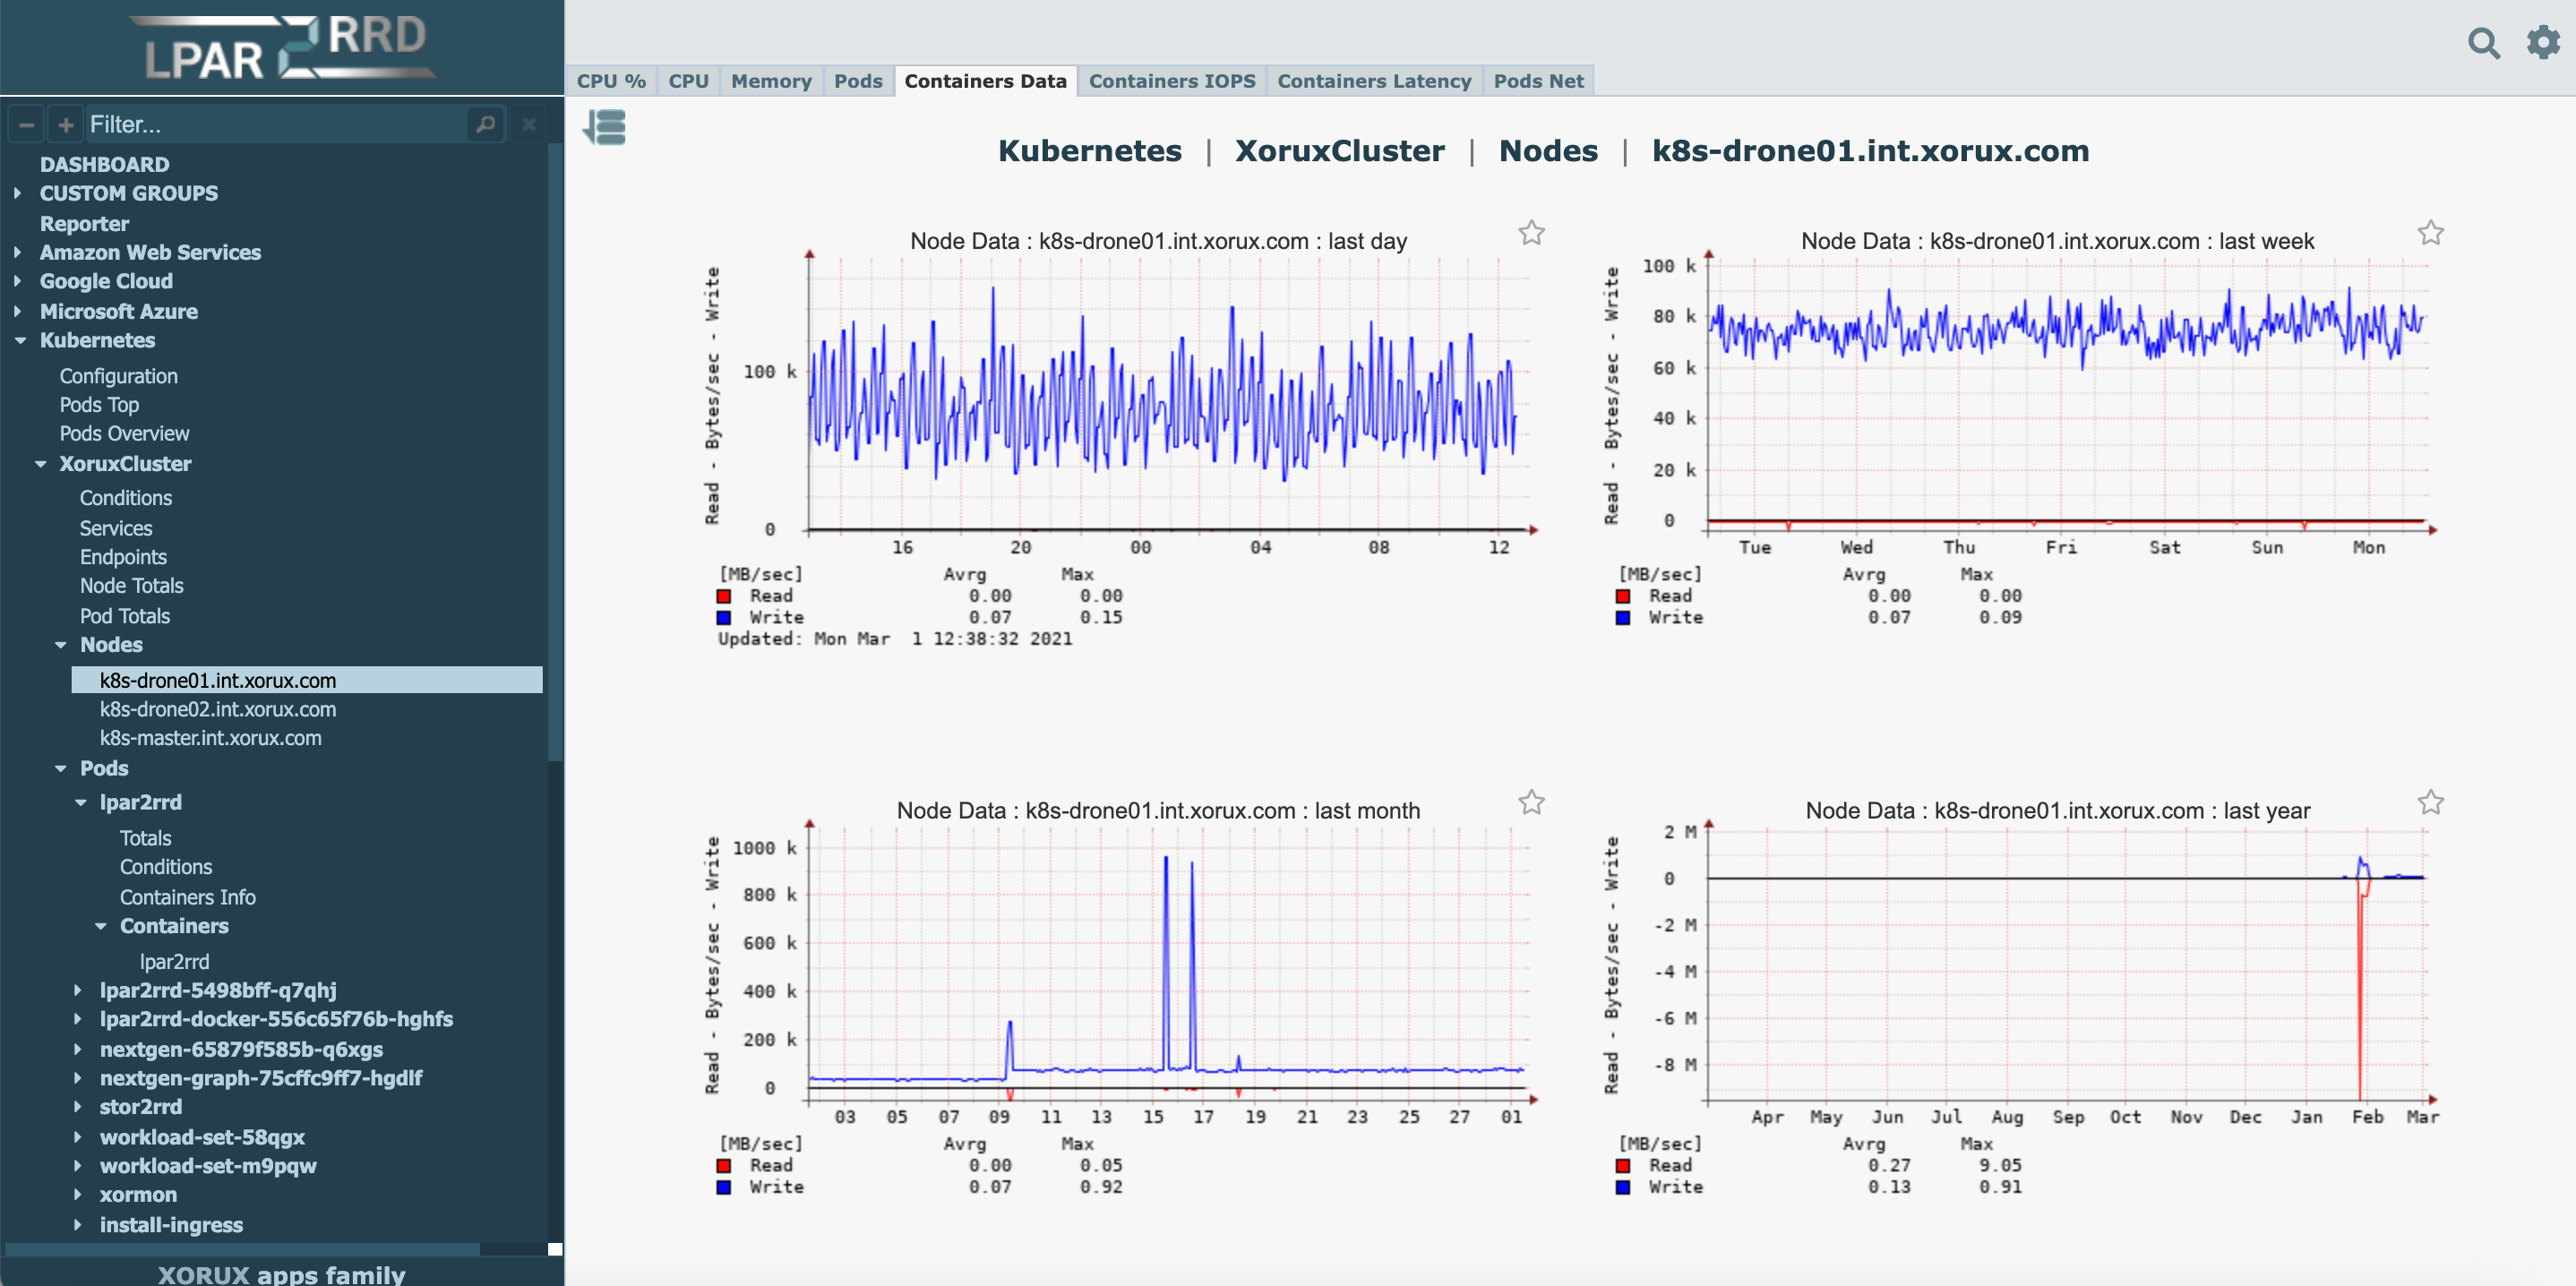 |
CPU Containers per Pod 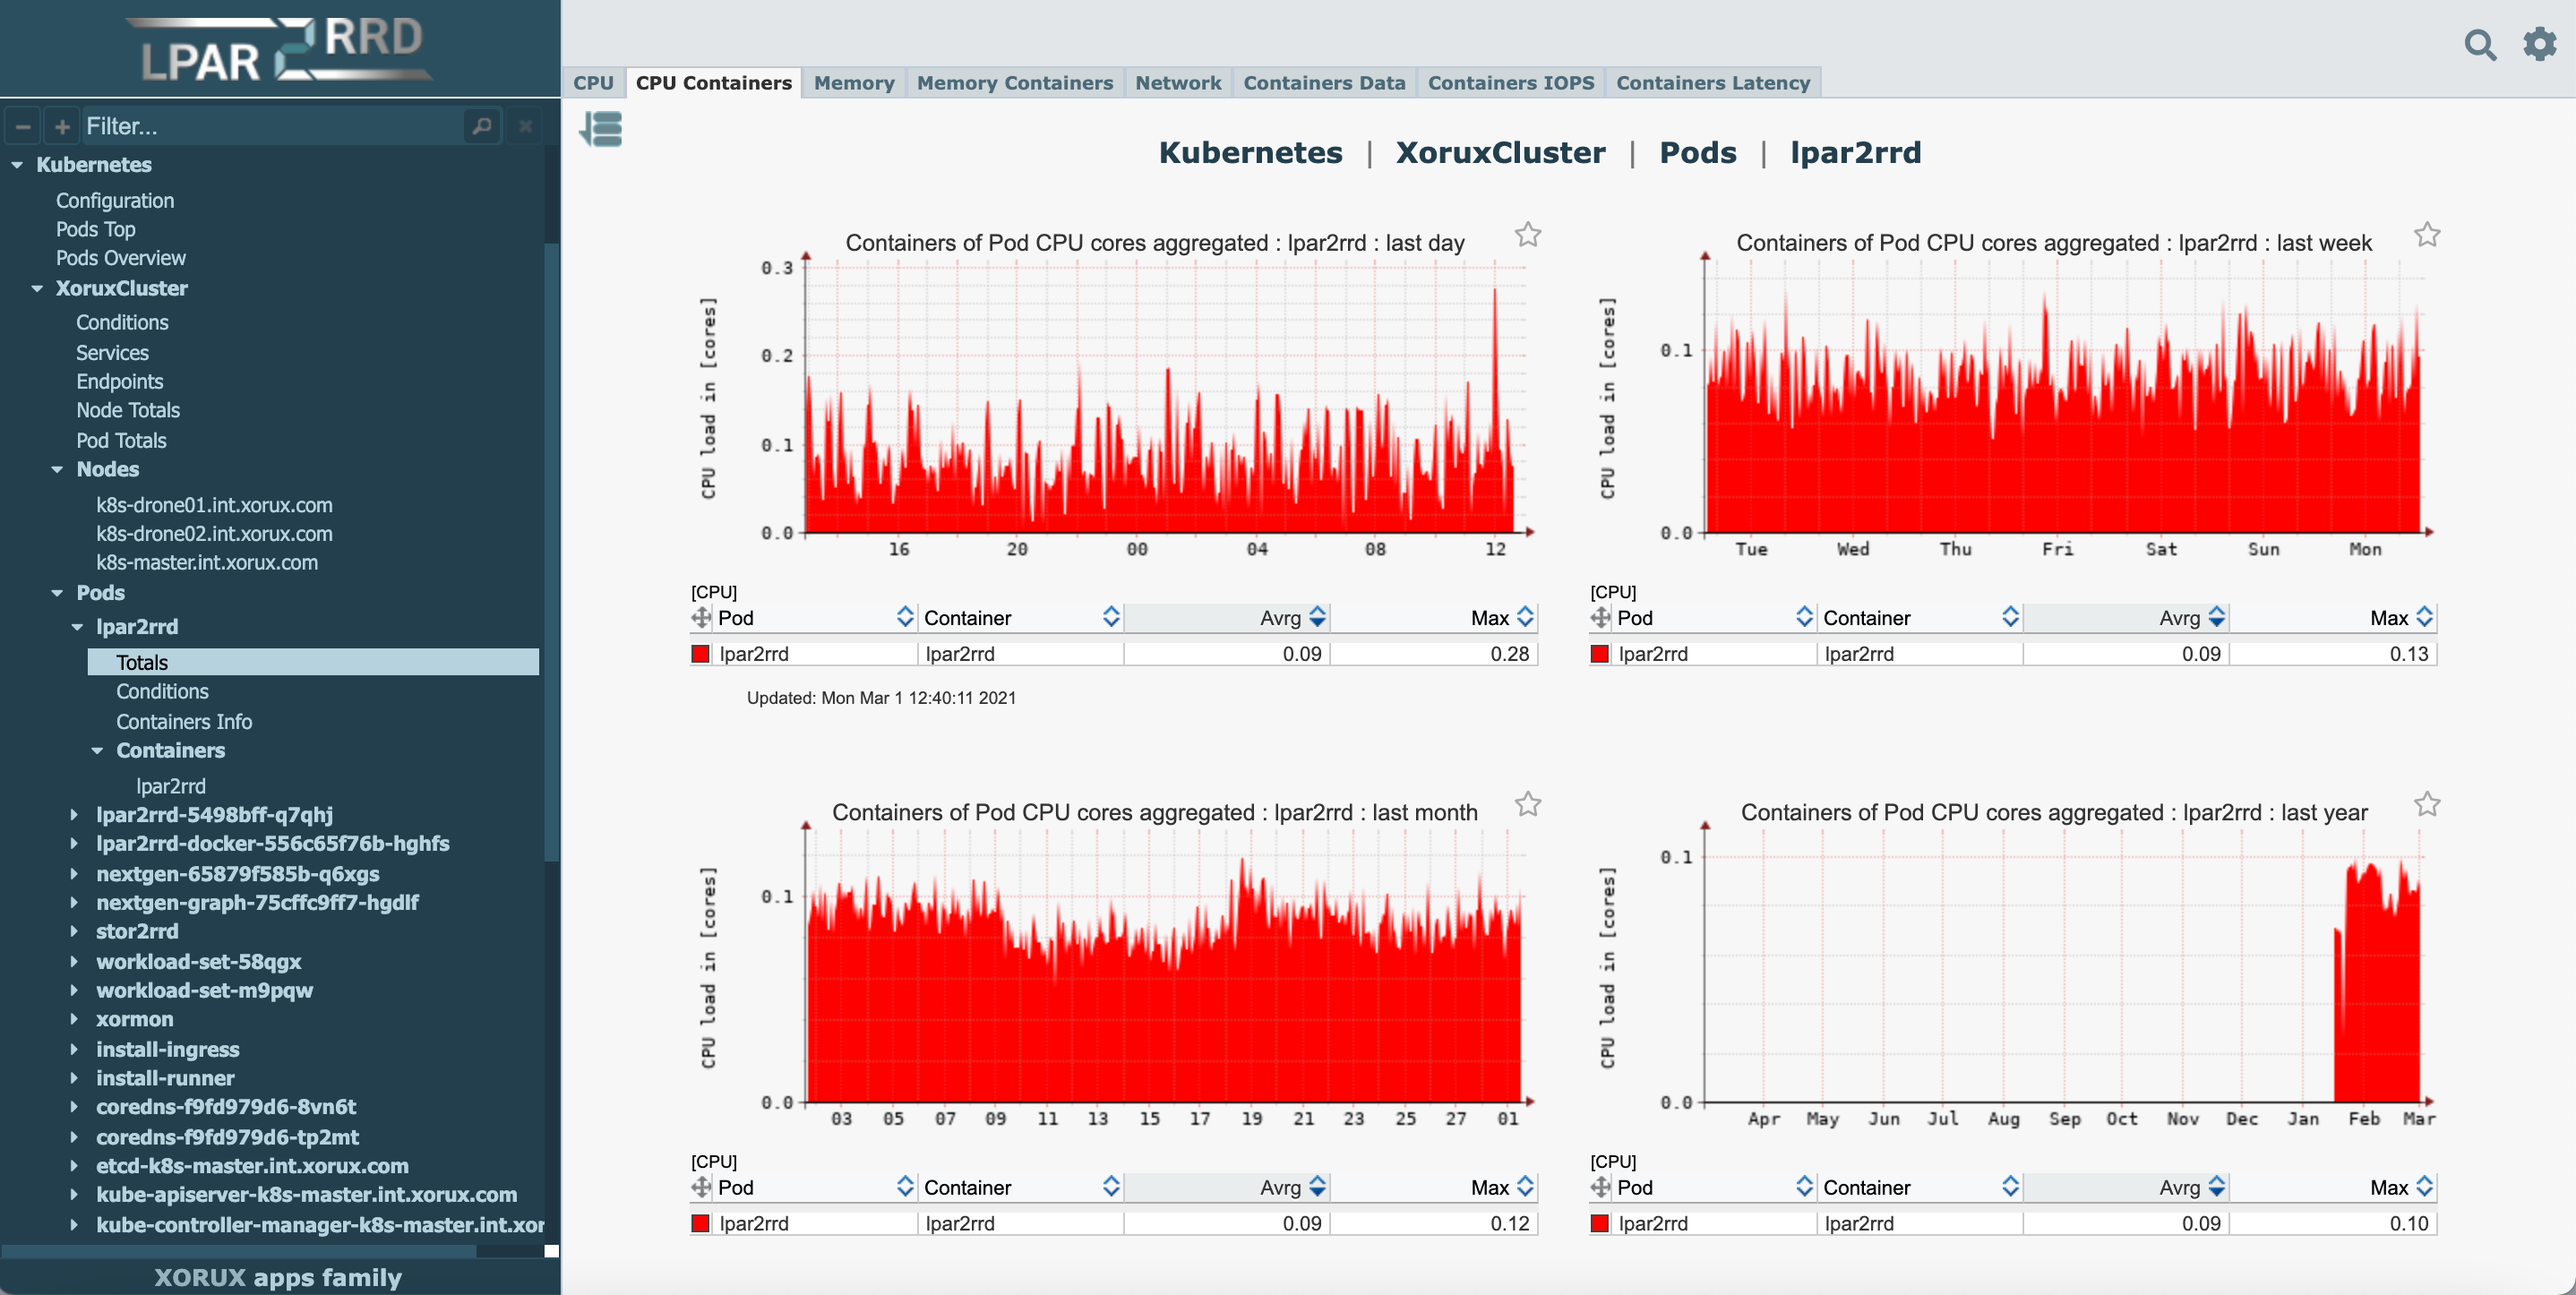 |
Containers IOPS 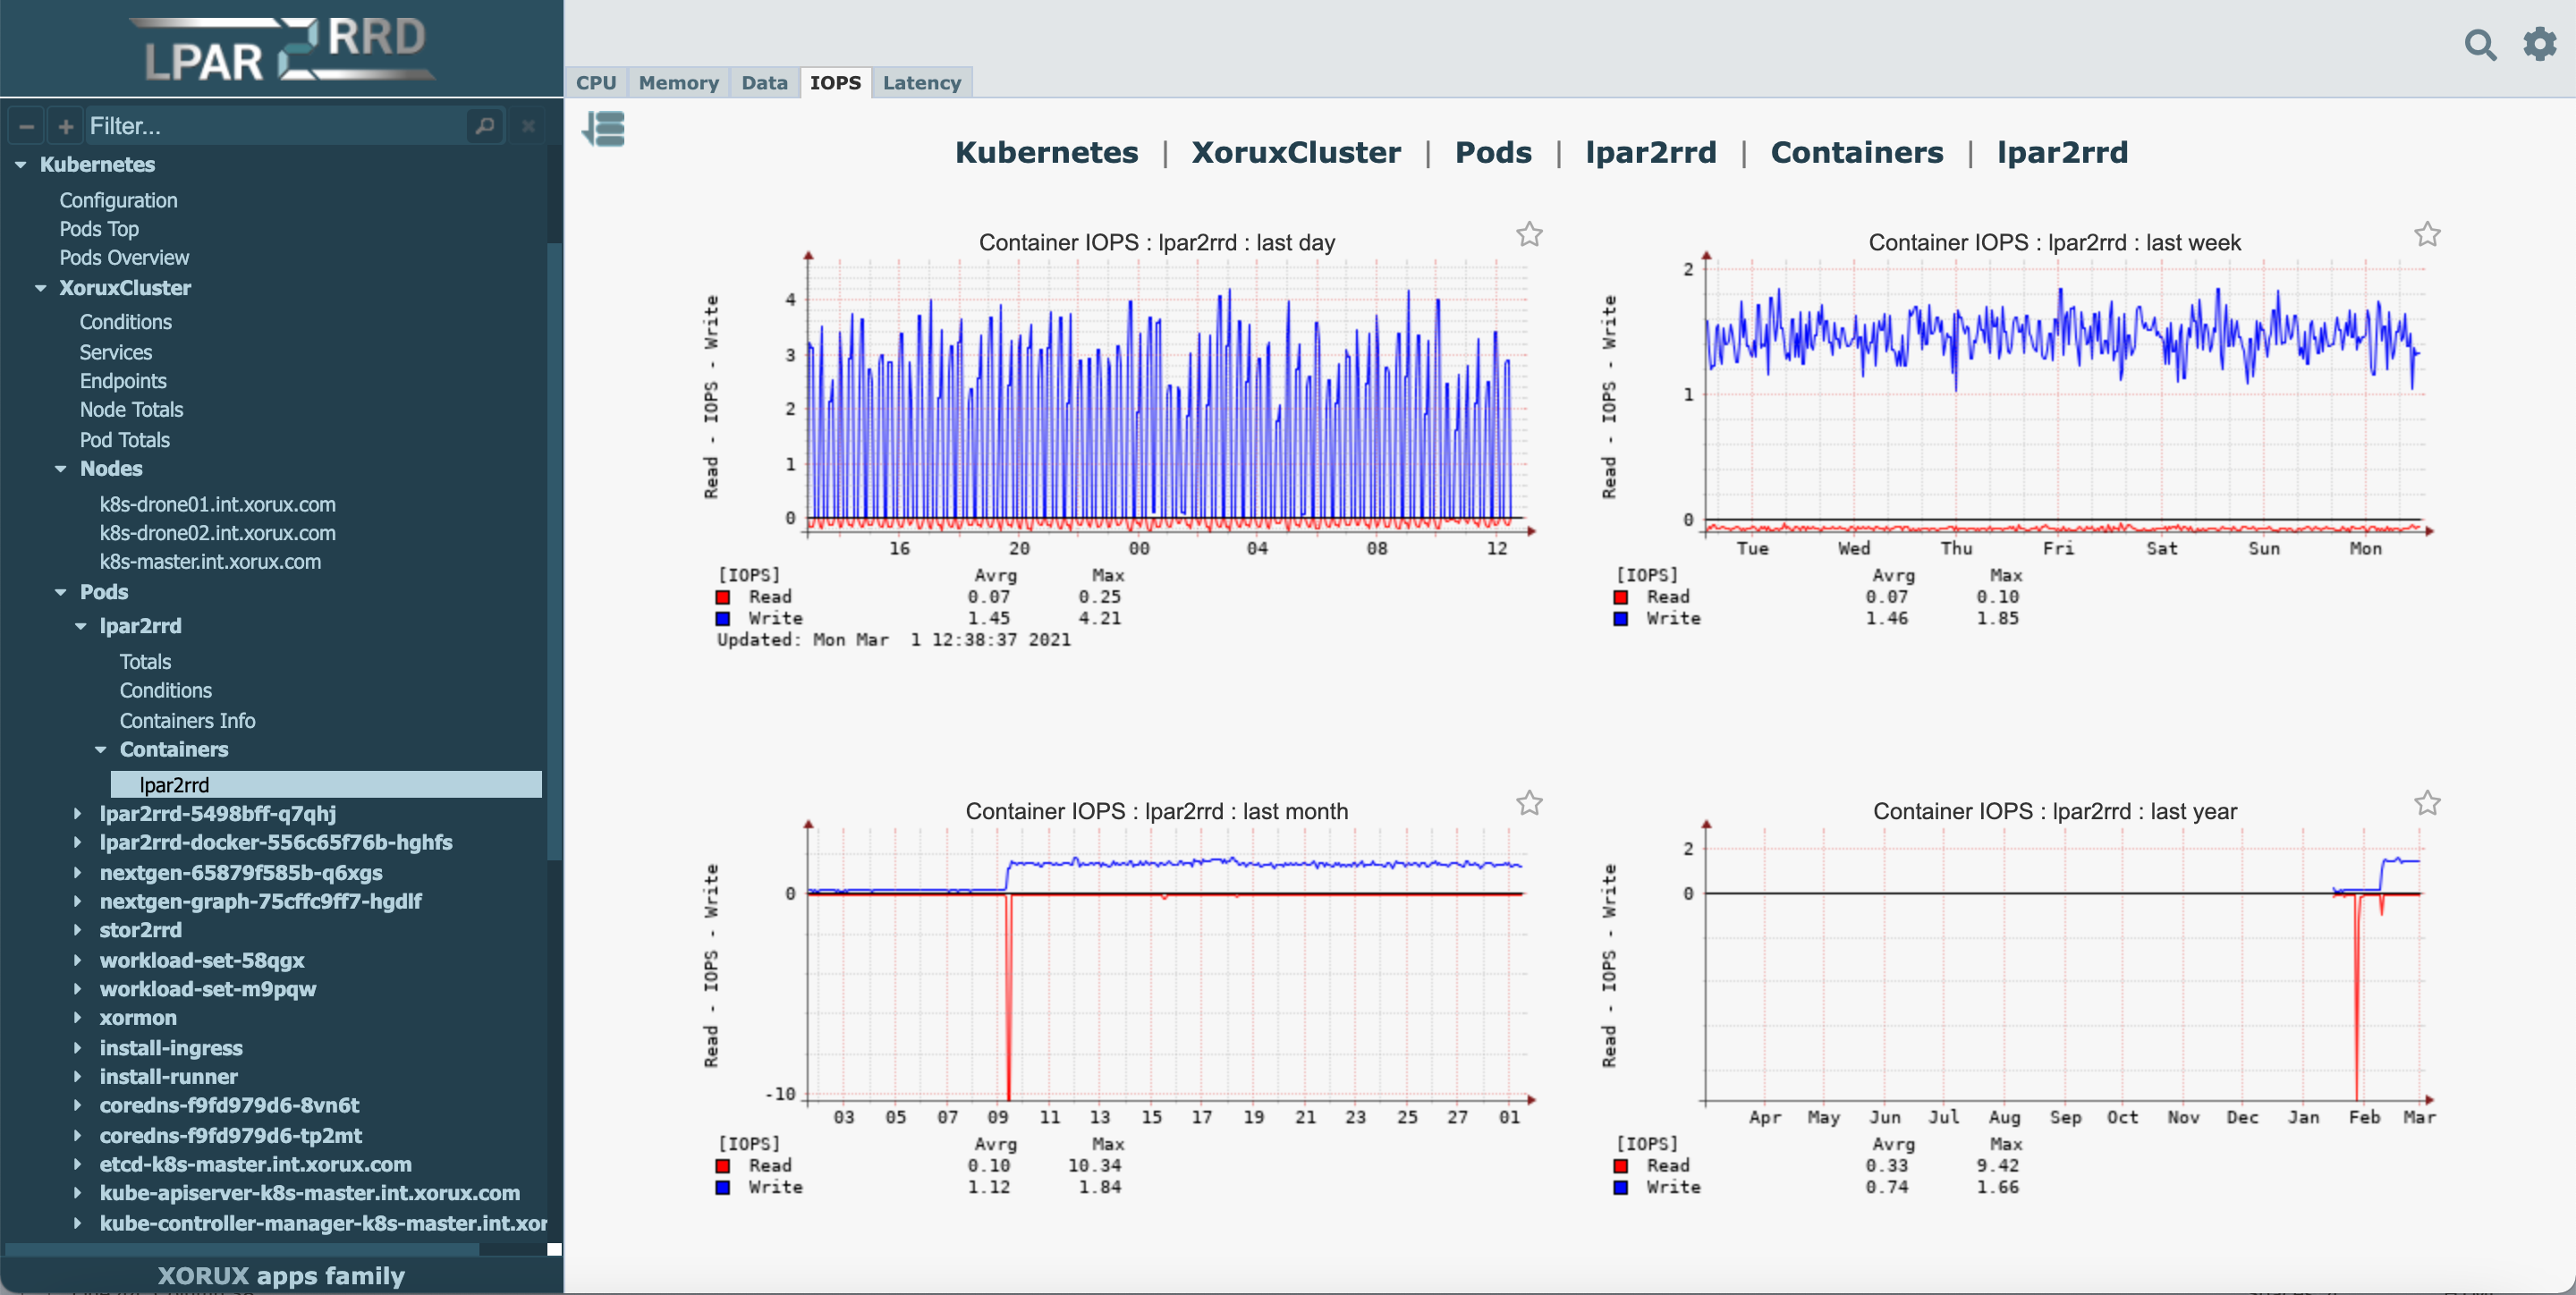 |
Collected Metrics
-
Host
- CPU
- CPU Ghz
- Memory
- Net
-
VM
- CPU MHz
- Memory
- IOPS
- Data
- Net
-
Volume
- Capacity
- IOPS
- Data
-
Primary Storage
- Capacity
- Allocated
You can see implementation on Free Demo
Examples
VM CPU aggr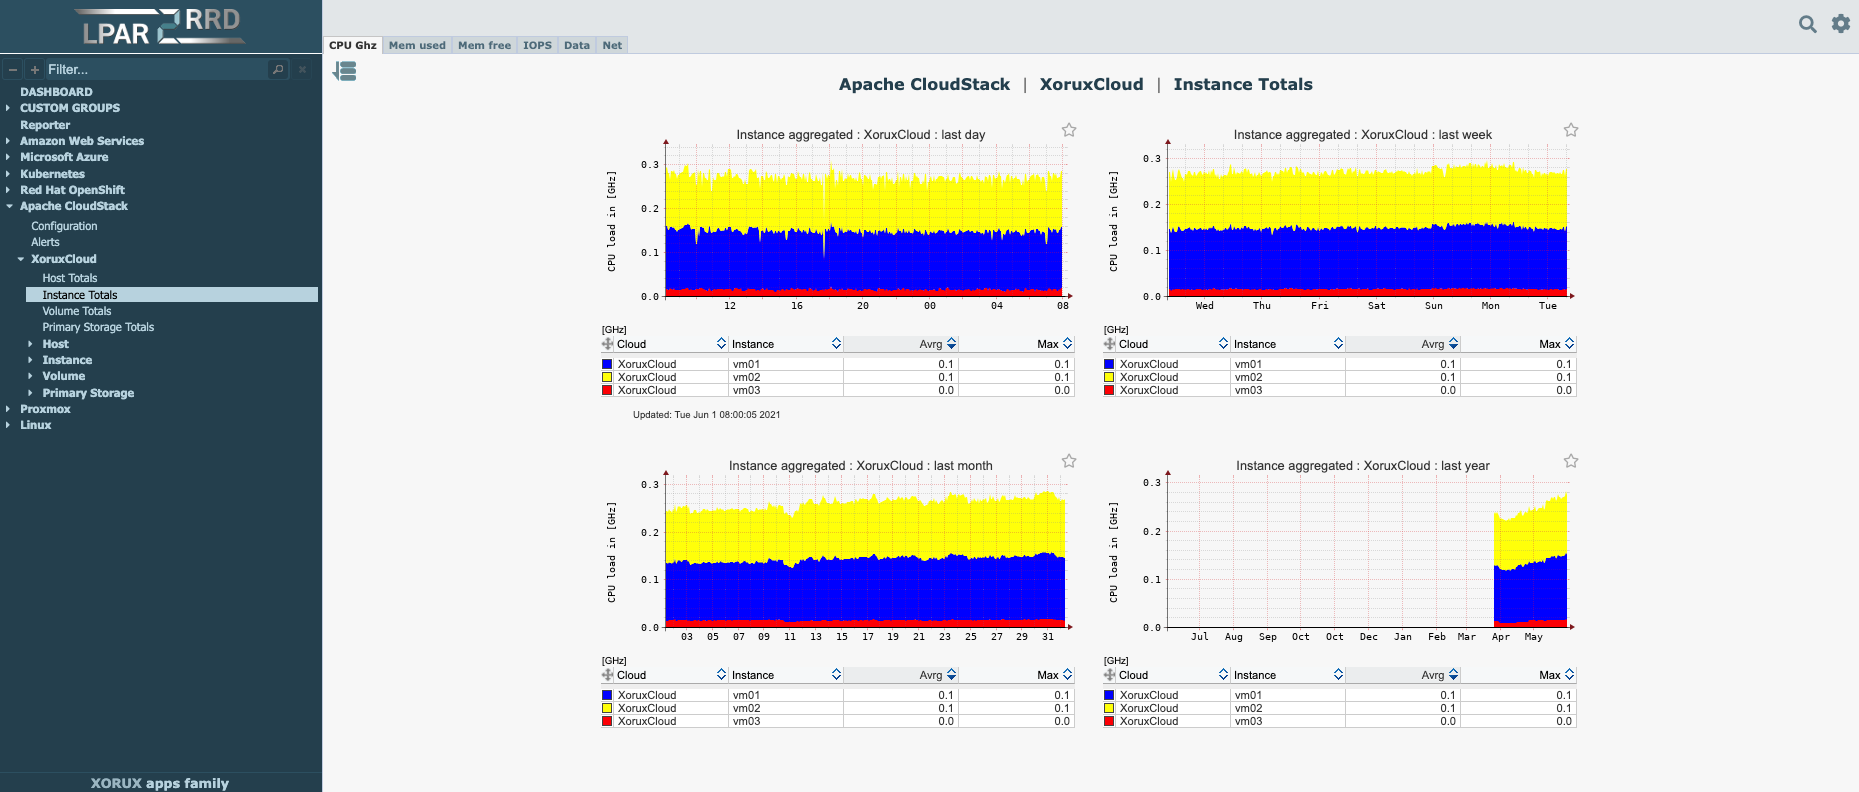 |
Host net aggr 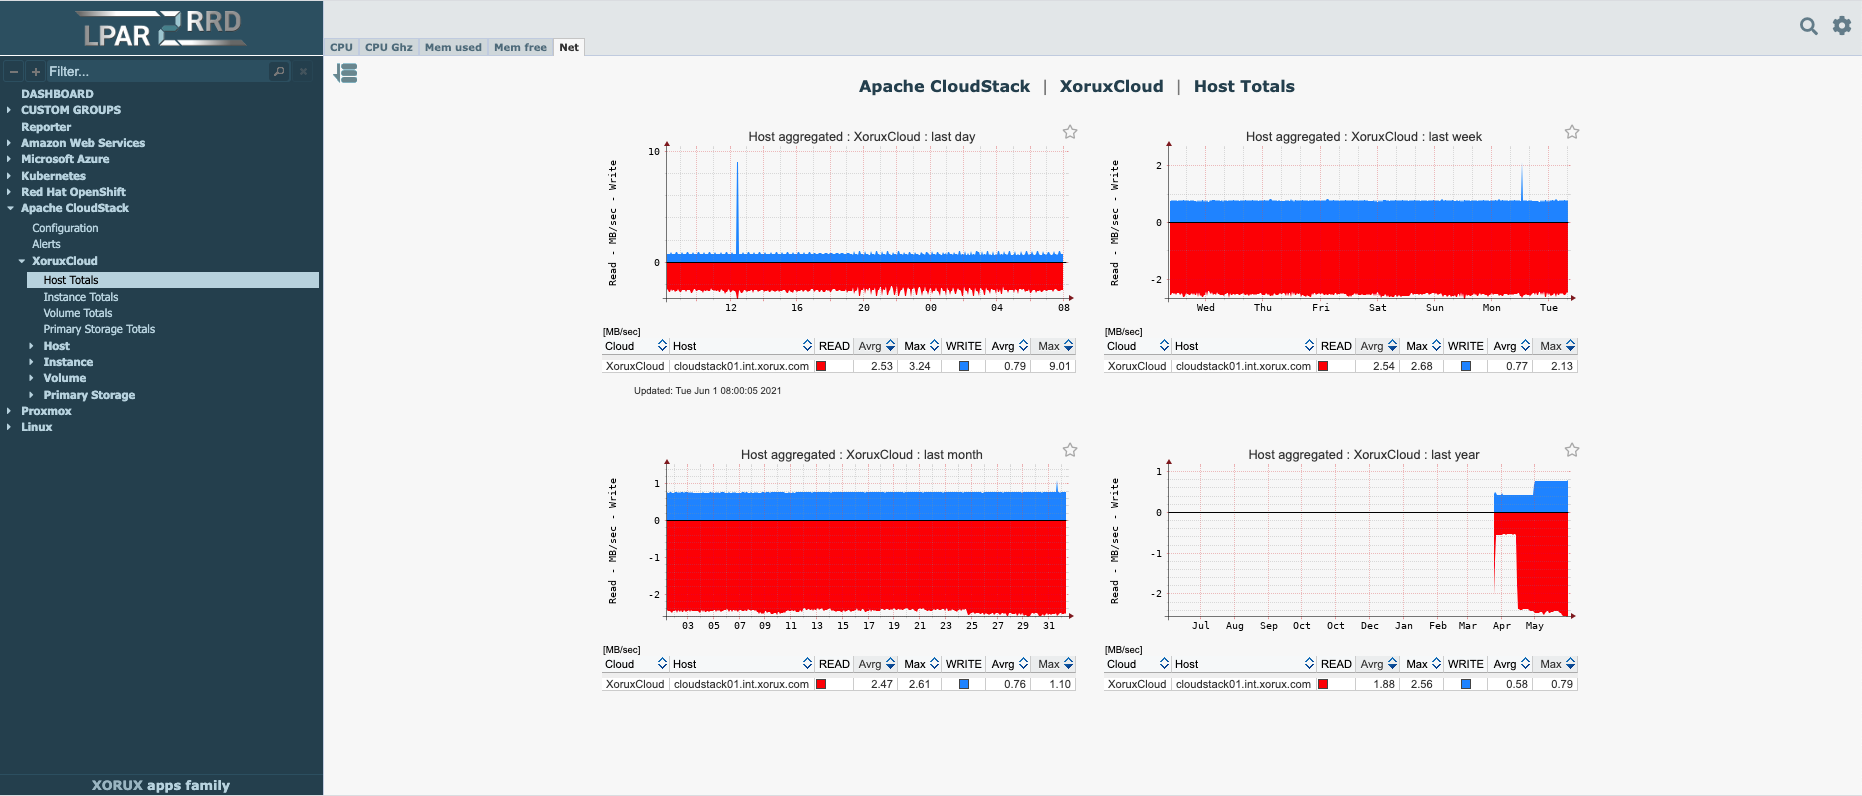 |
Volume capacity 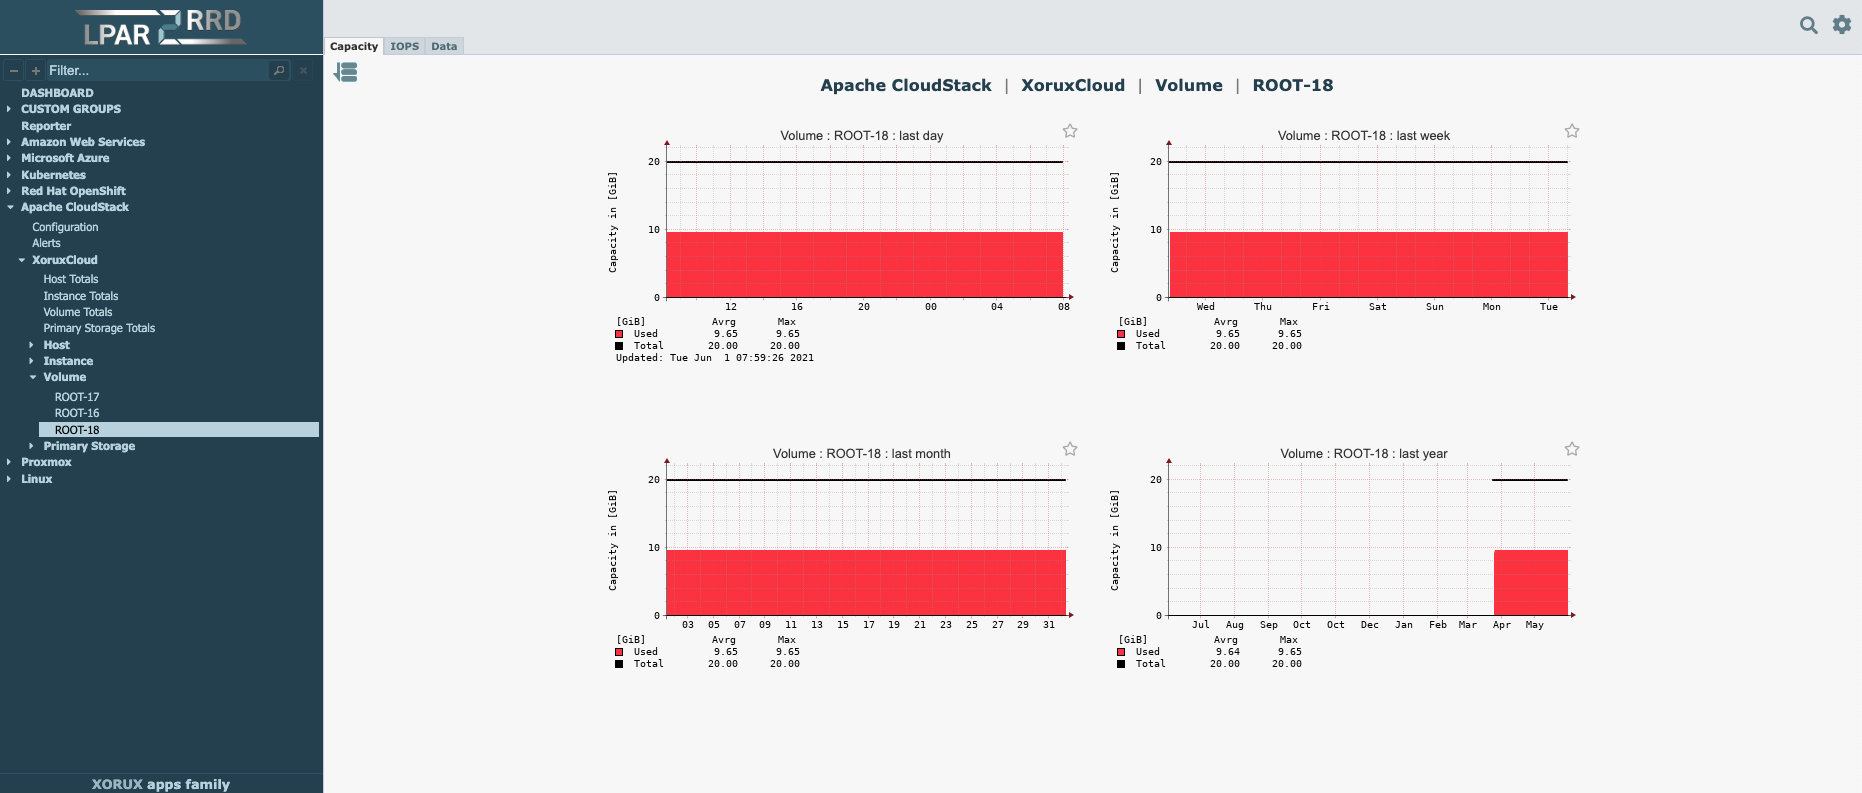 |
Primary storage allocated 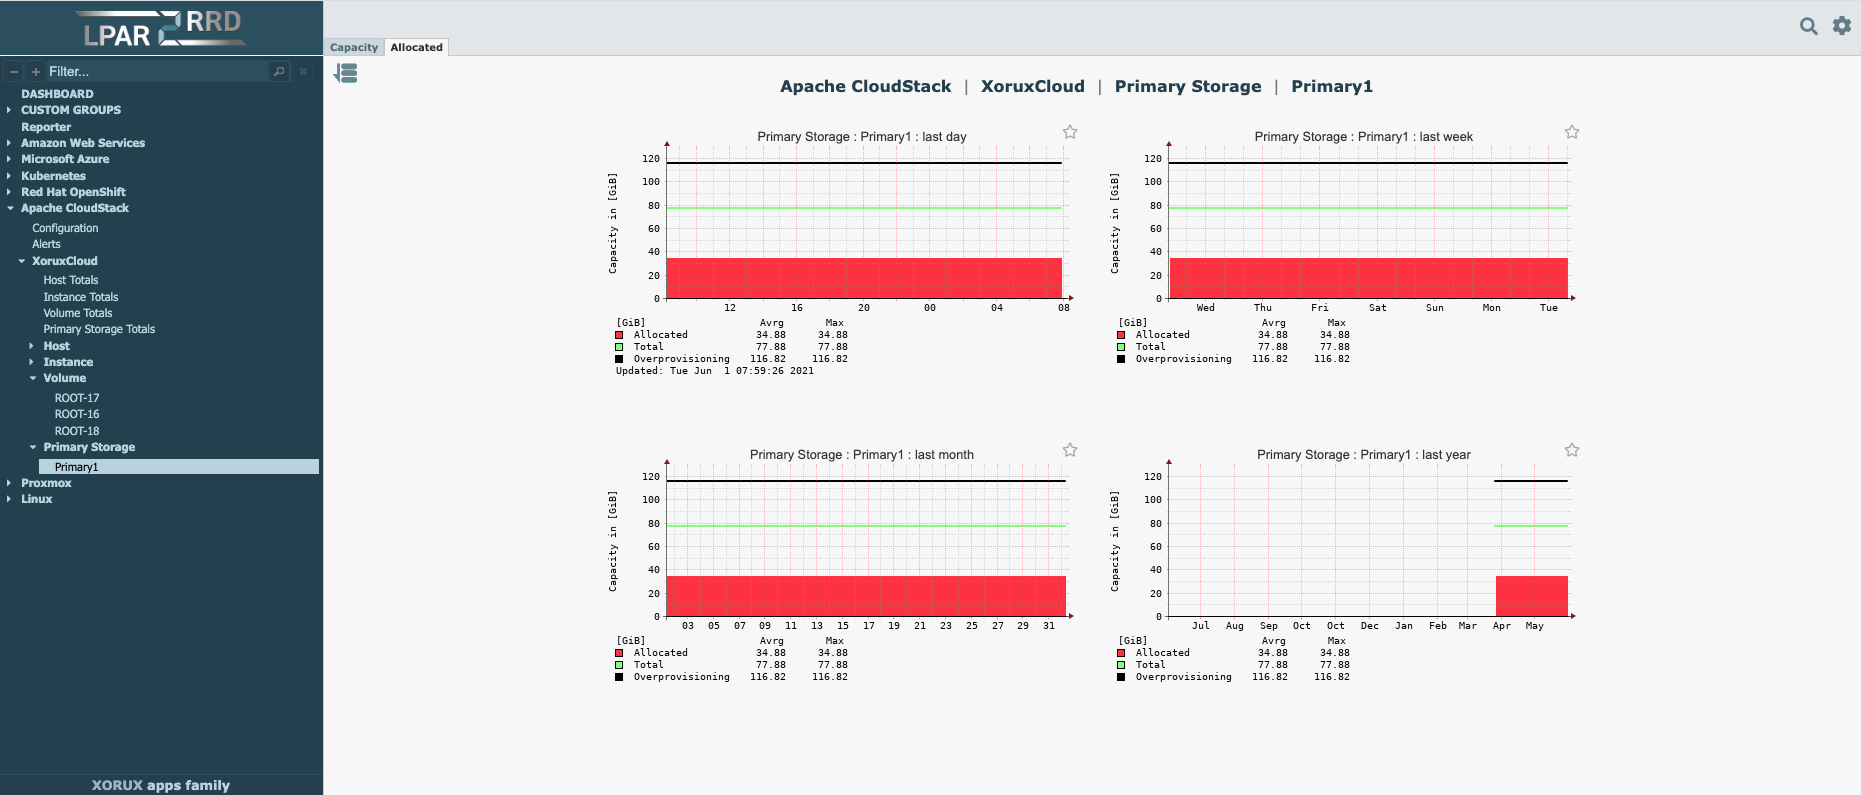 |
Volume used capacity aggr 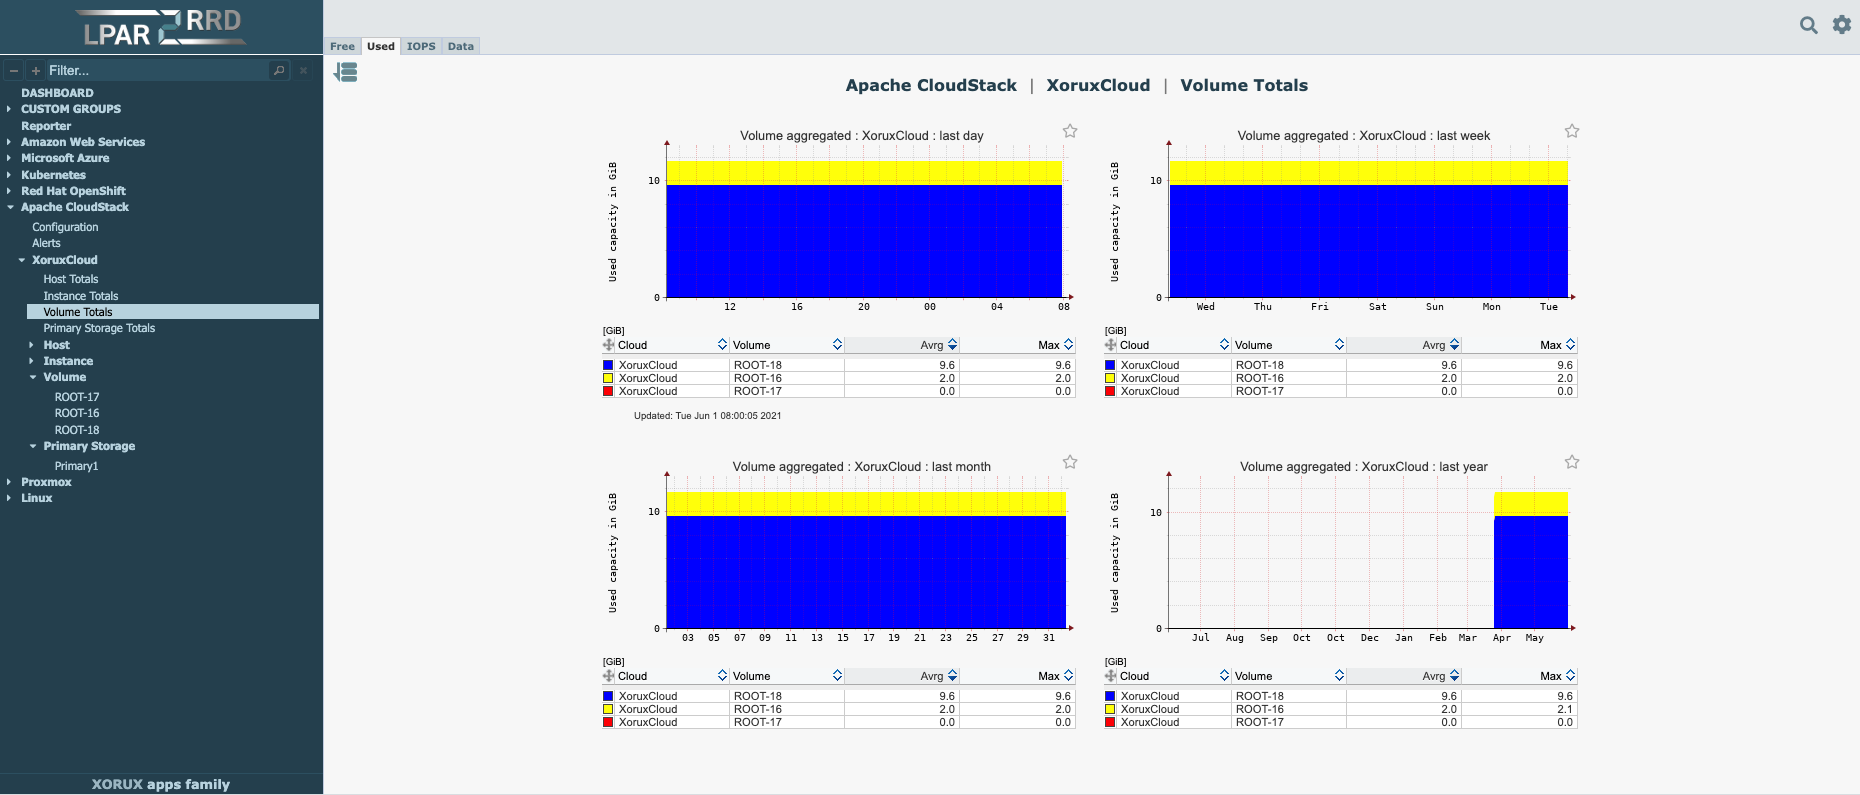 |
Supported services
- Compute Engine
- Google SQL
Collected Metrics
-
Compute Engine
- CPU %
- Data
- IOPS
- Net
- Memory*
- Processes*
-
Google SQL
-
MySQL
- CPU %
- IOPS
- Net
- Memory
- Storage
- Connections
- Queries
- Questions
- InnoDB Pages
- InnoDB Buffer
- InnoDB data fsync
- InnoDB log fsync
-
Postgres
- CPU %
- IOPS
- Net
- Memory
- Storage
- Connections
- Transactions
-
MySQL
* with Cloud Monitoring Agent
You can see implementation on Free Demo
Examples
Configuration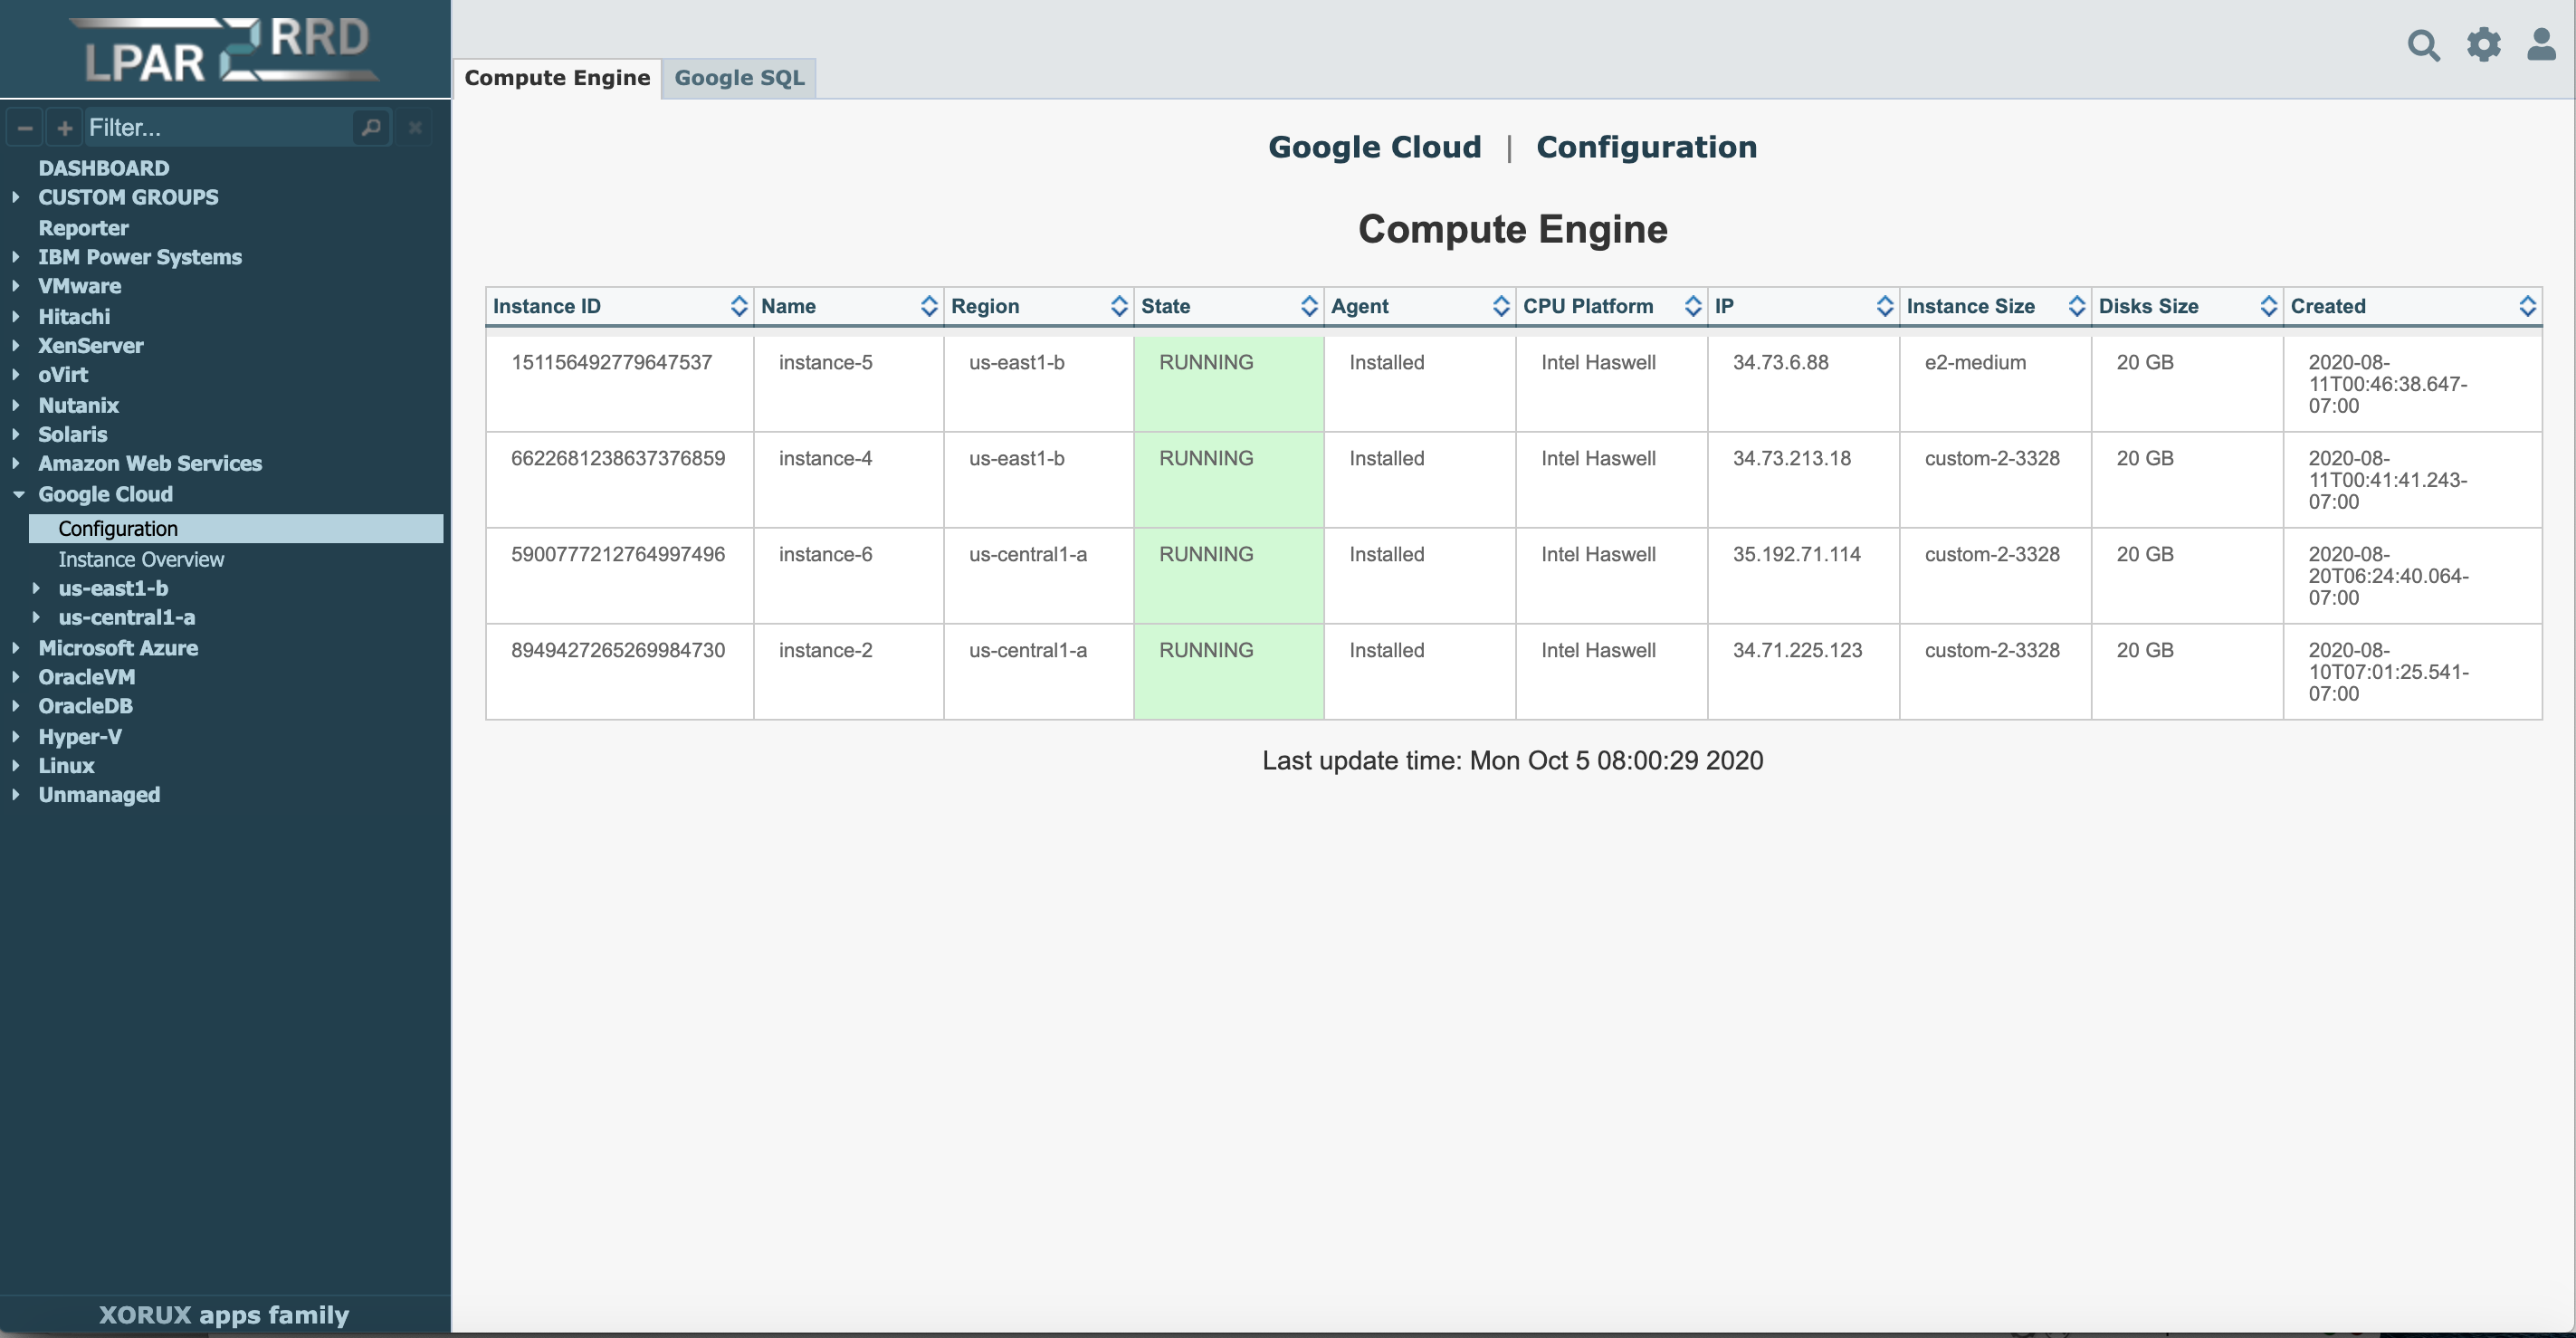 |
Compute Engine processes 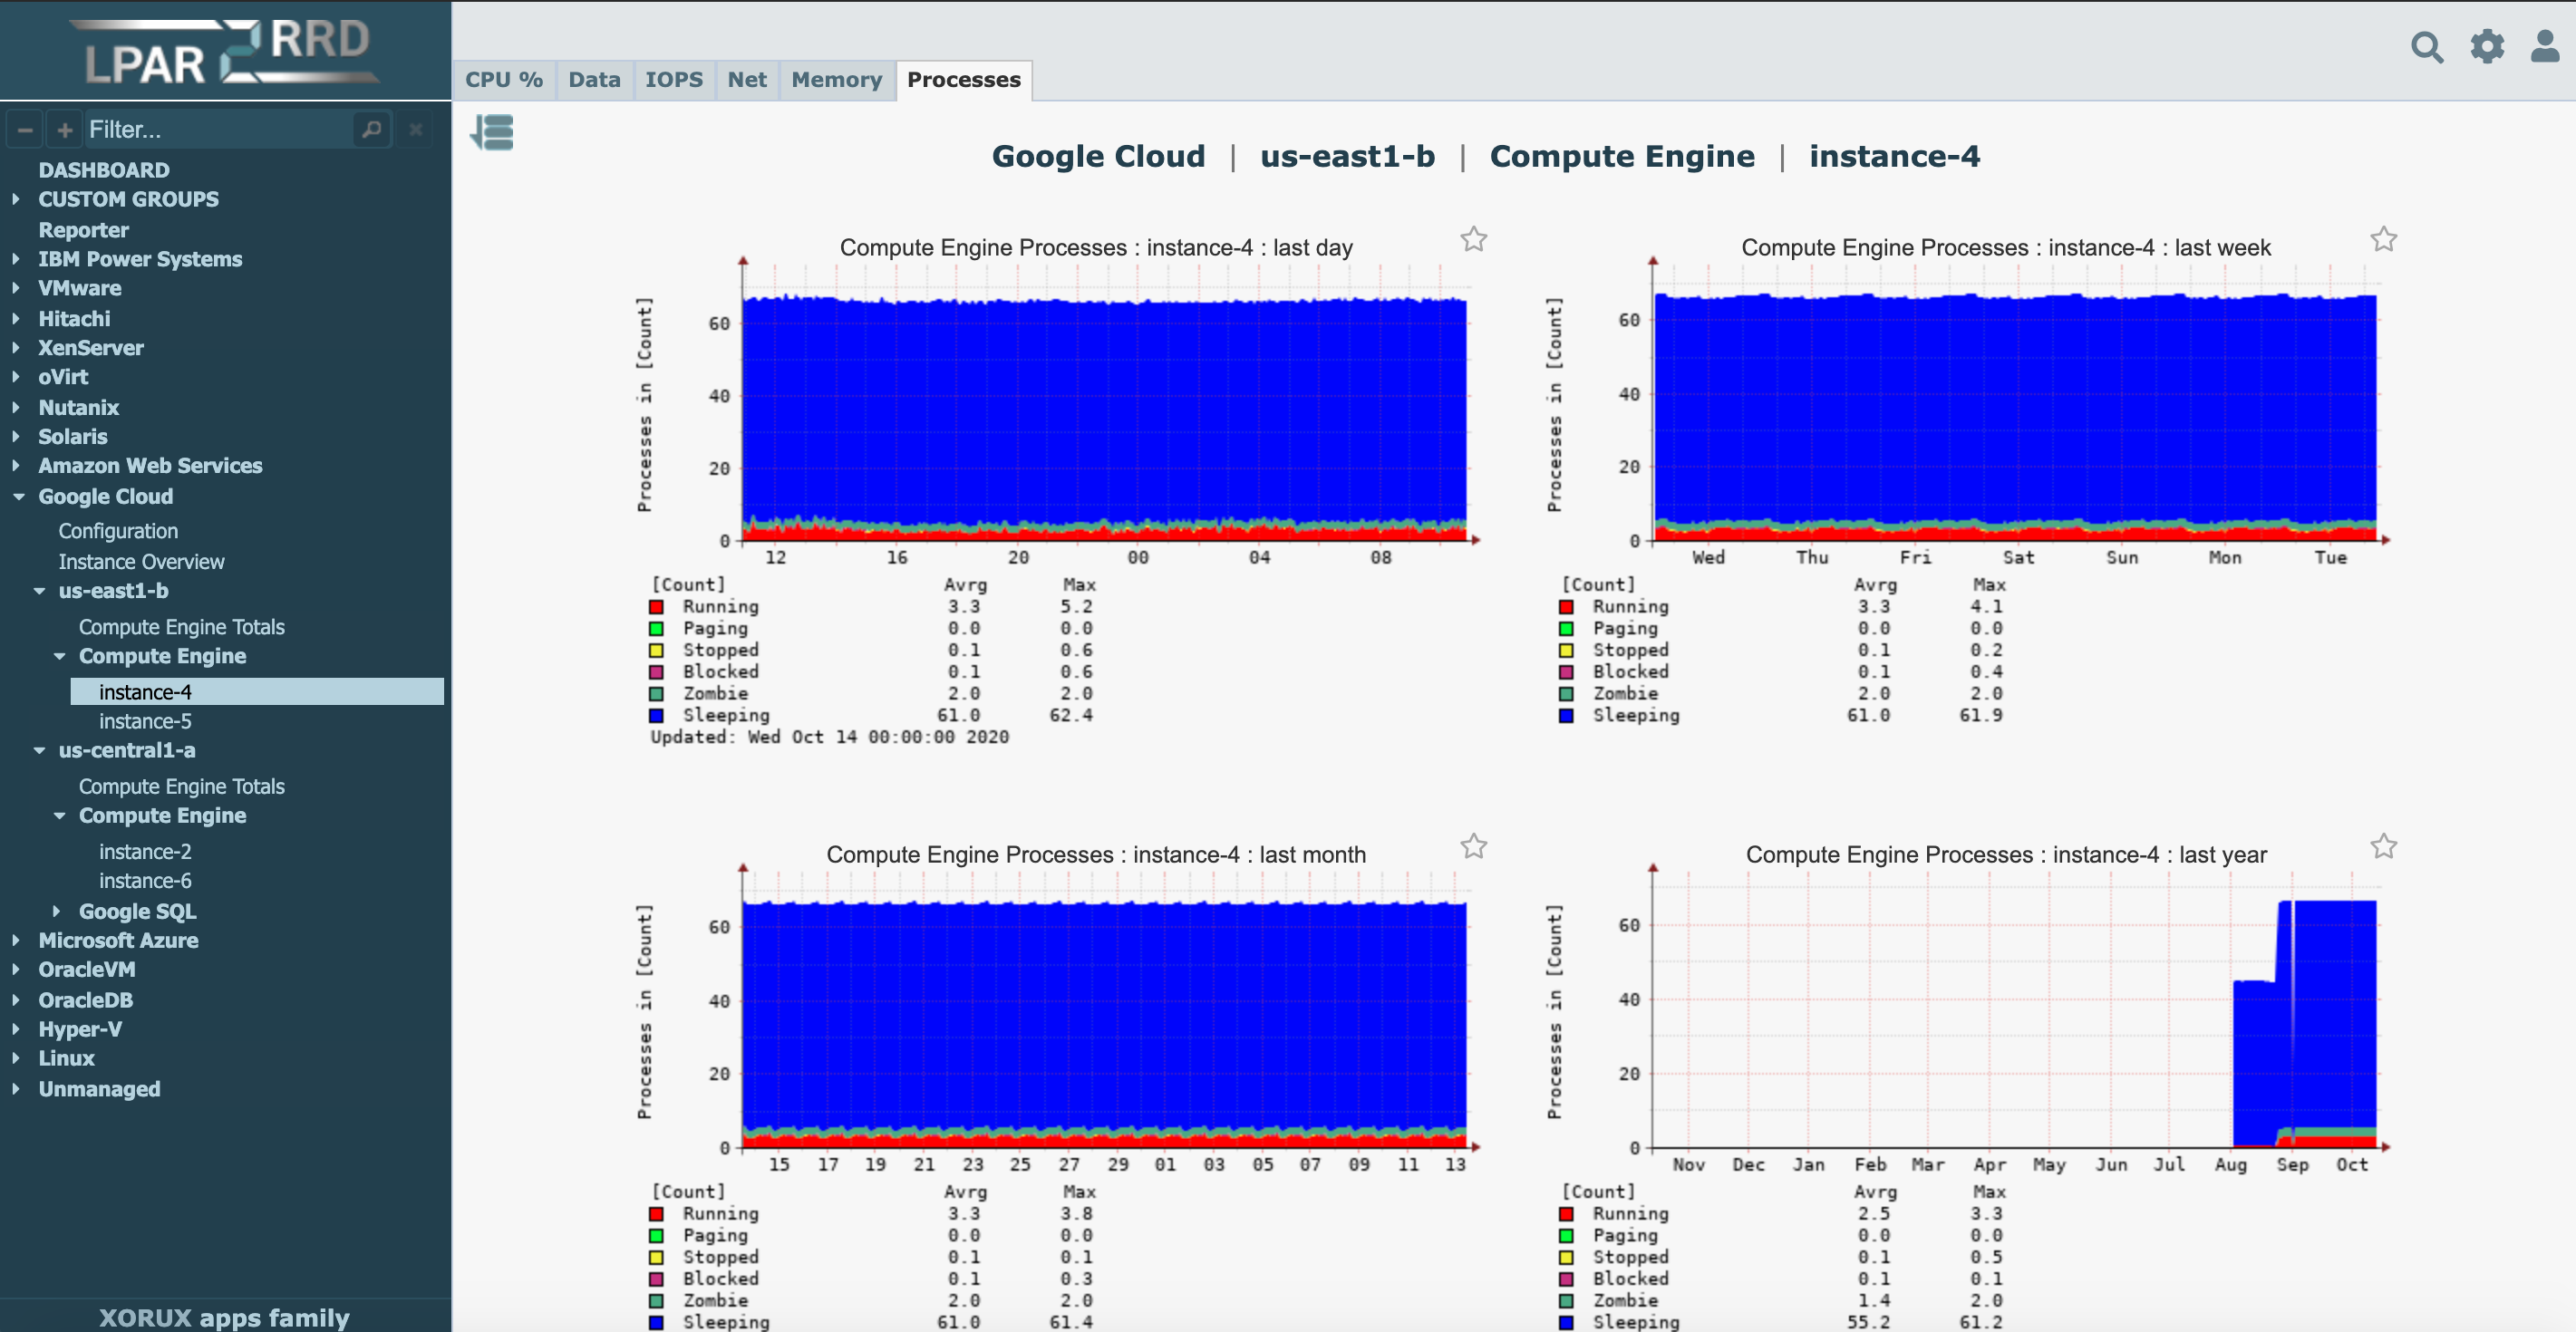 |
Compute Engine memory 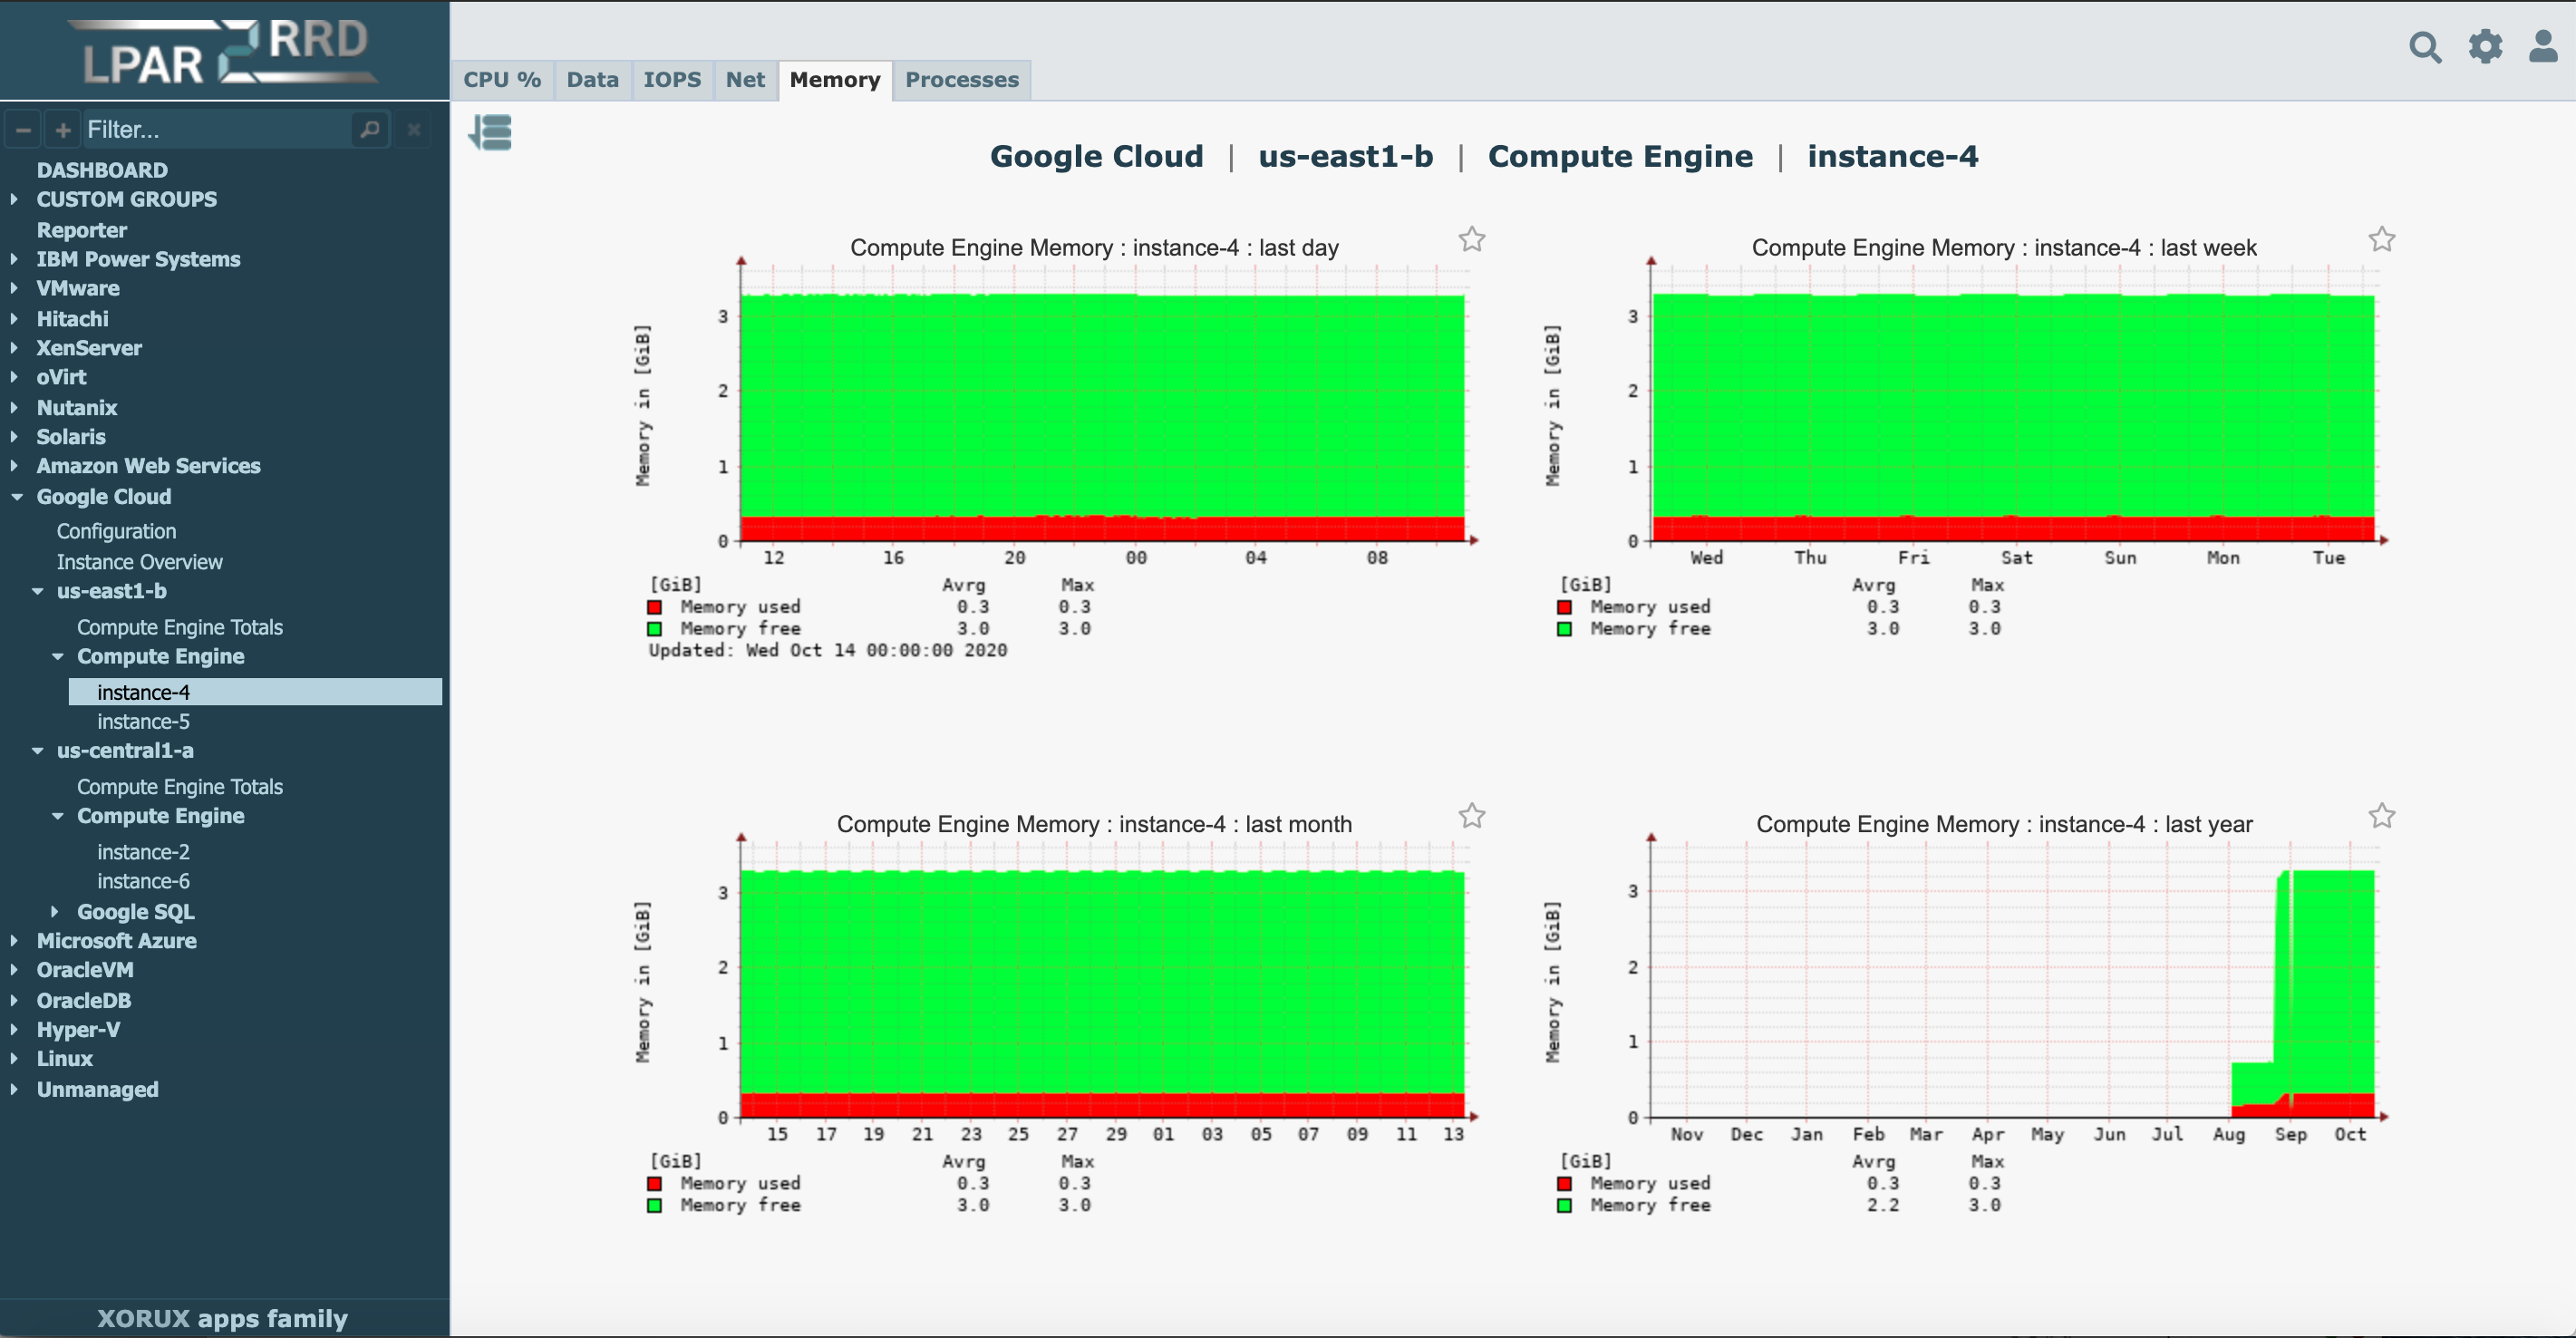 |
Google SQL InnoDB buffer 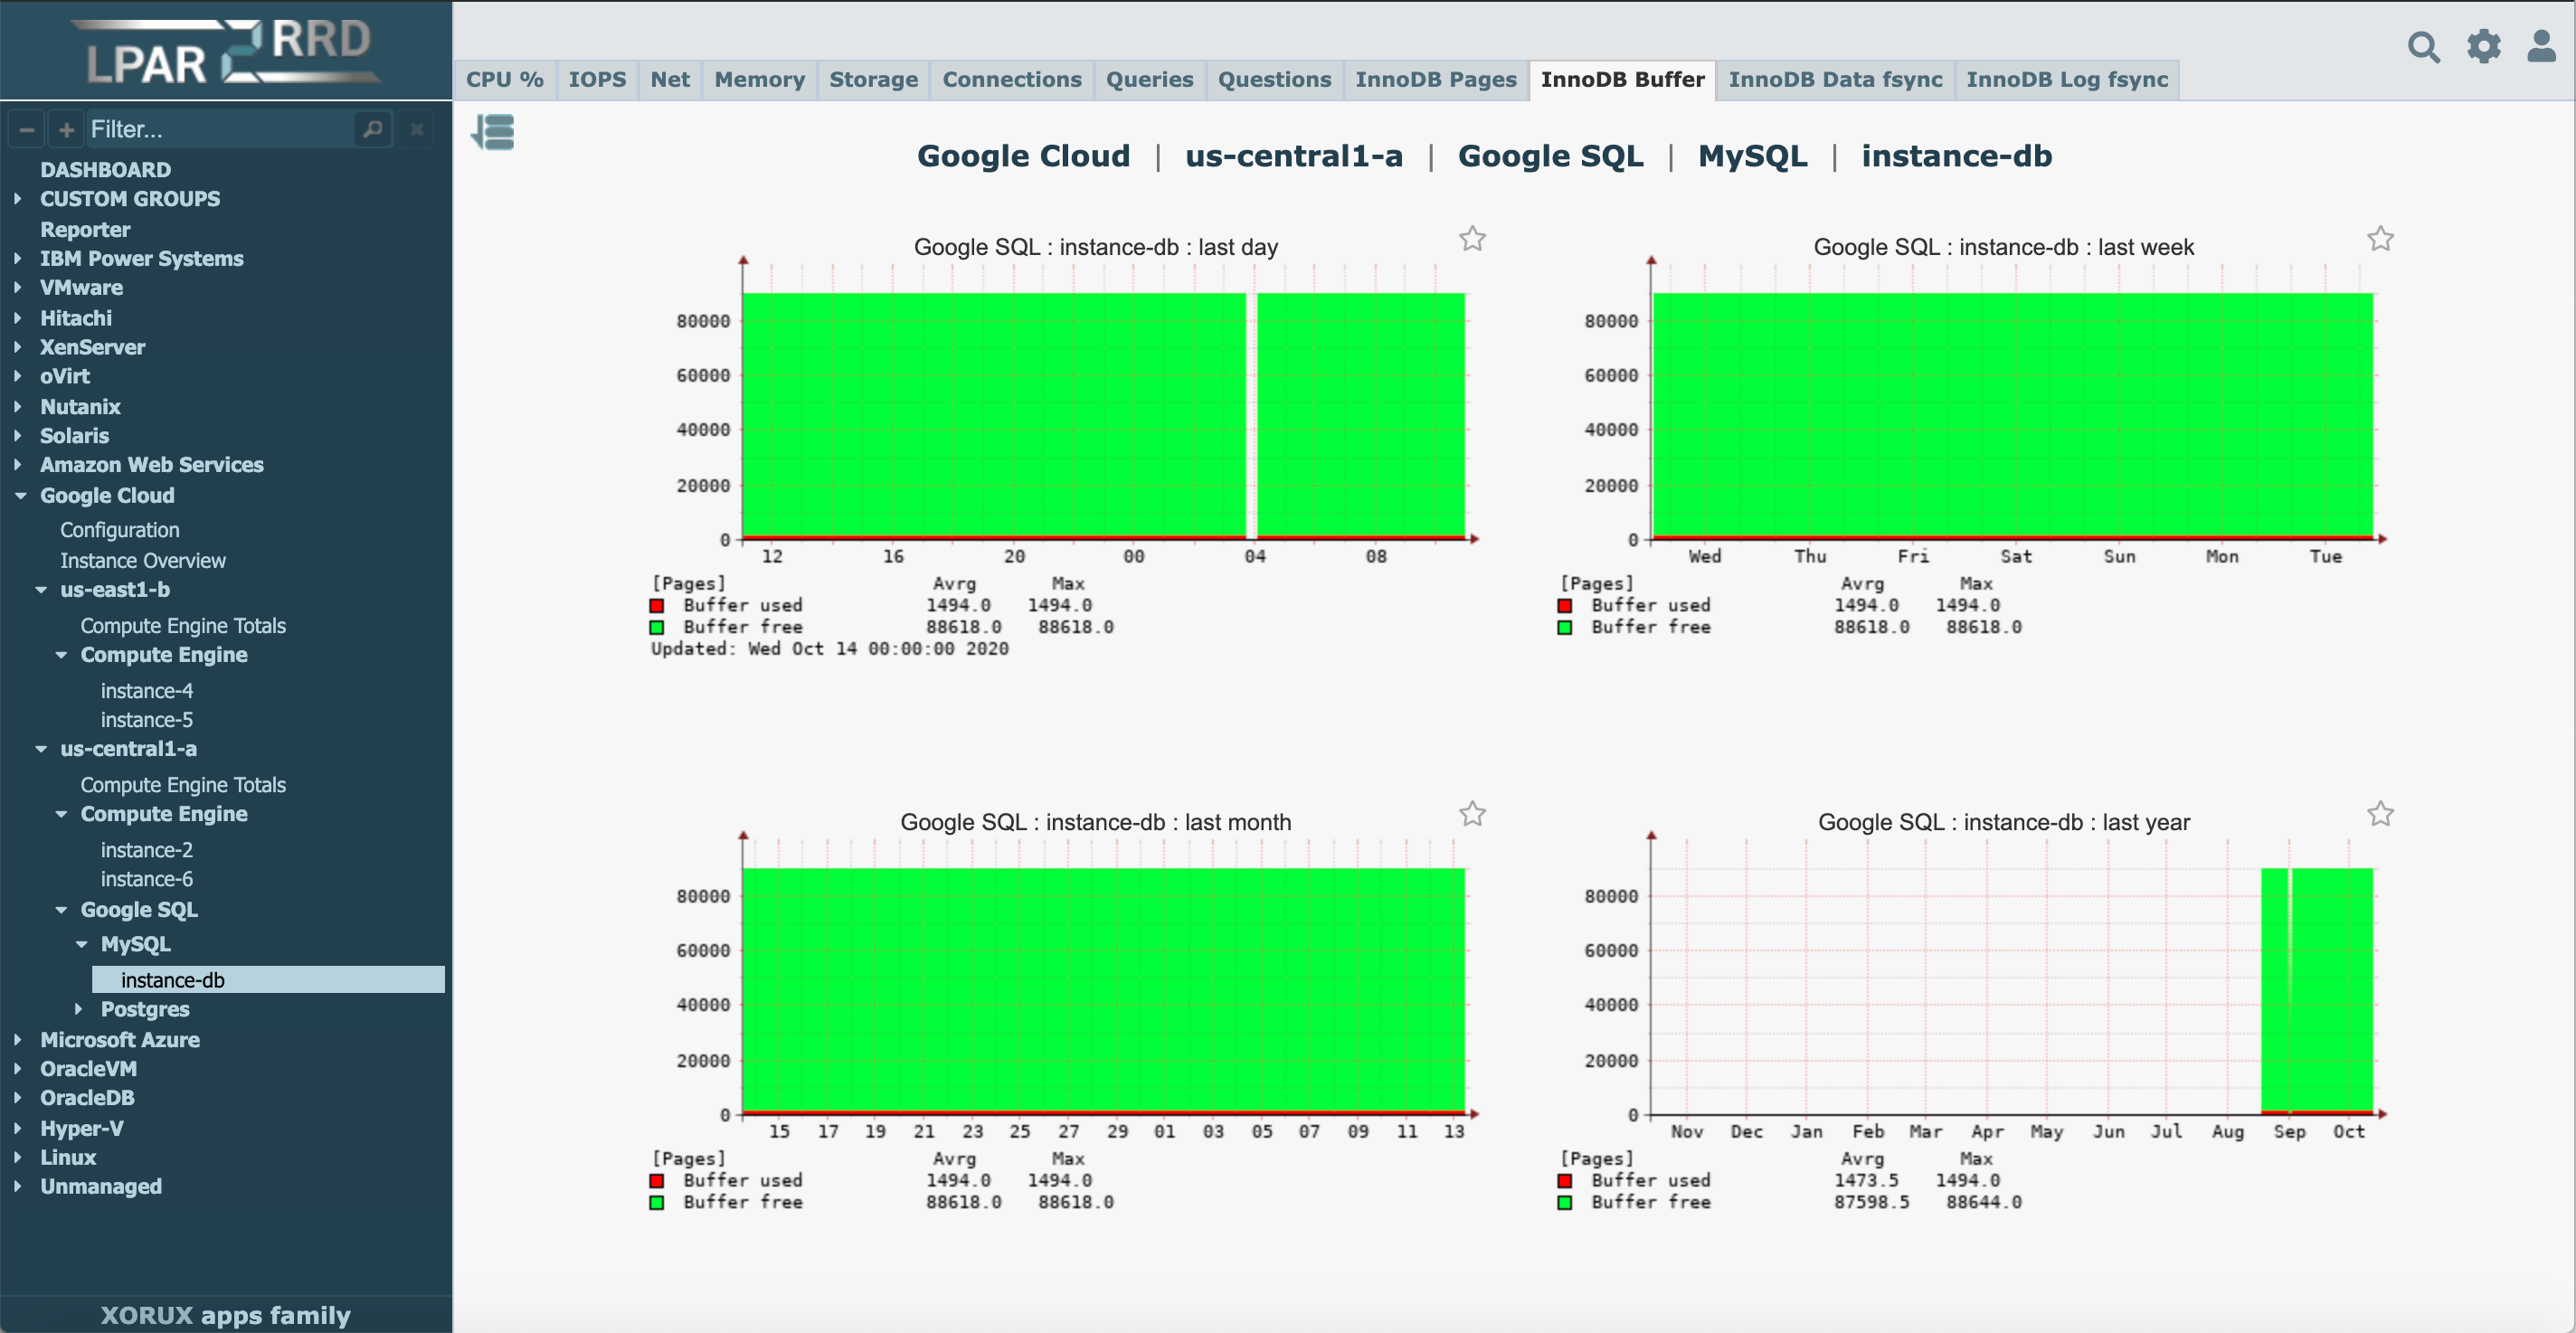 |
Supported services
- Elastic Compute Cloud
- Elastic Block Store
- Relational Database Service
- API Gateway
- Lambda
Collected Metrics
-
Elastic Compute Cloud
- CPU %
- Data
- IOPS
- Net
-
Elastic Block Store
- Data
- IOPS
-
Relational Database Service
- CPU %
- Data
- IOPS
- Net
- DB Connection
- Free memory
- Free storage
- Latency
-
API Gateway
- Count
- 5xx Error
- 4xx Error
- Latency
- Integration Latency
-
Lambda
- Invocation
- Errors
- Duration
- Throttles
- Concurrent Executions
You can see implementation on Free Demo
Examples
Configuration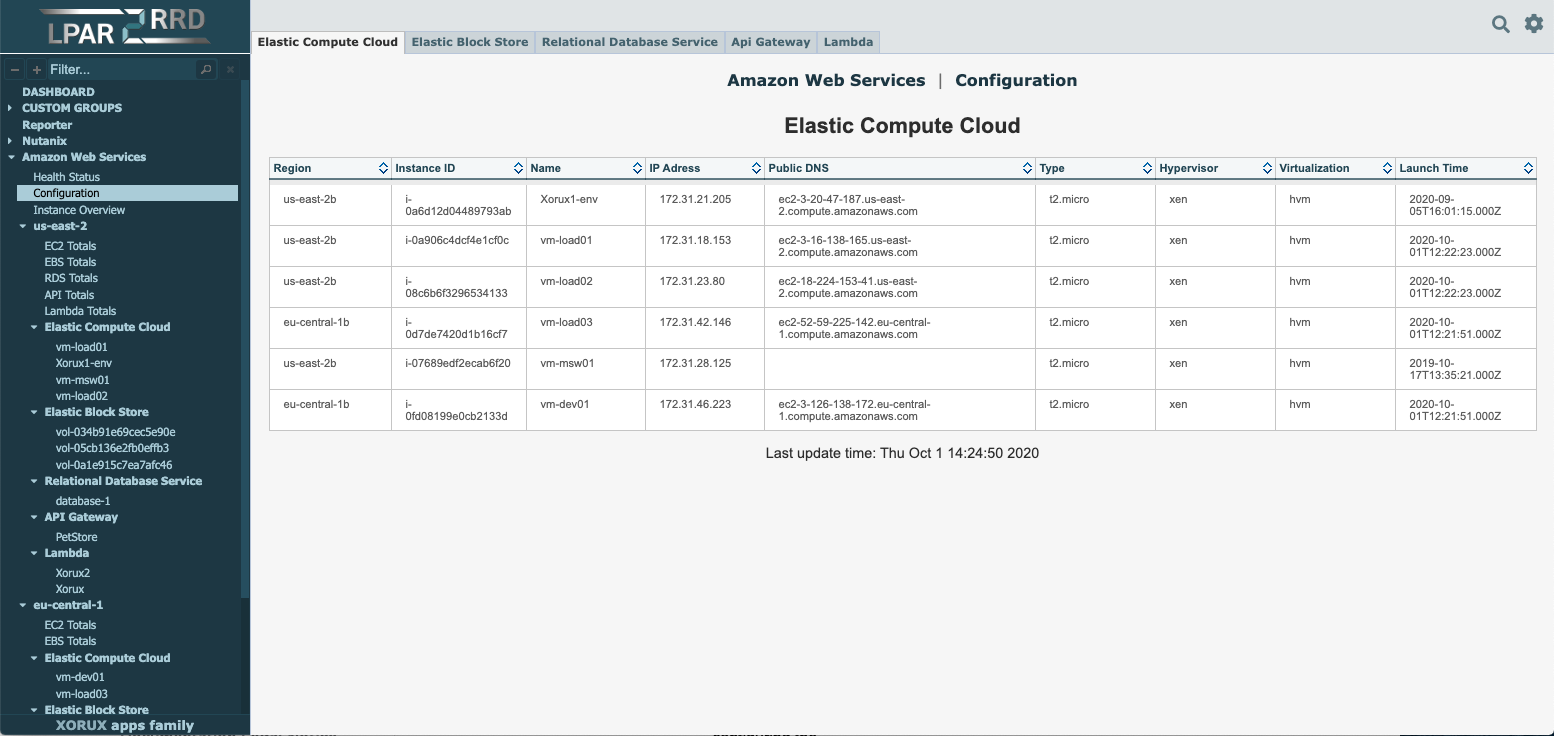 |
RDS connections 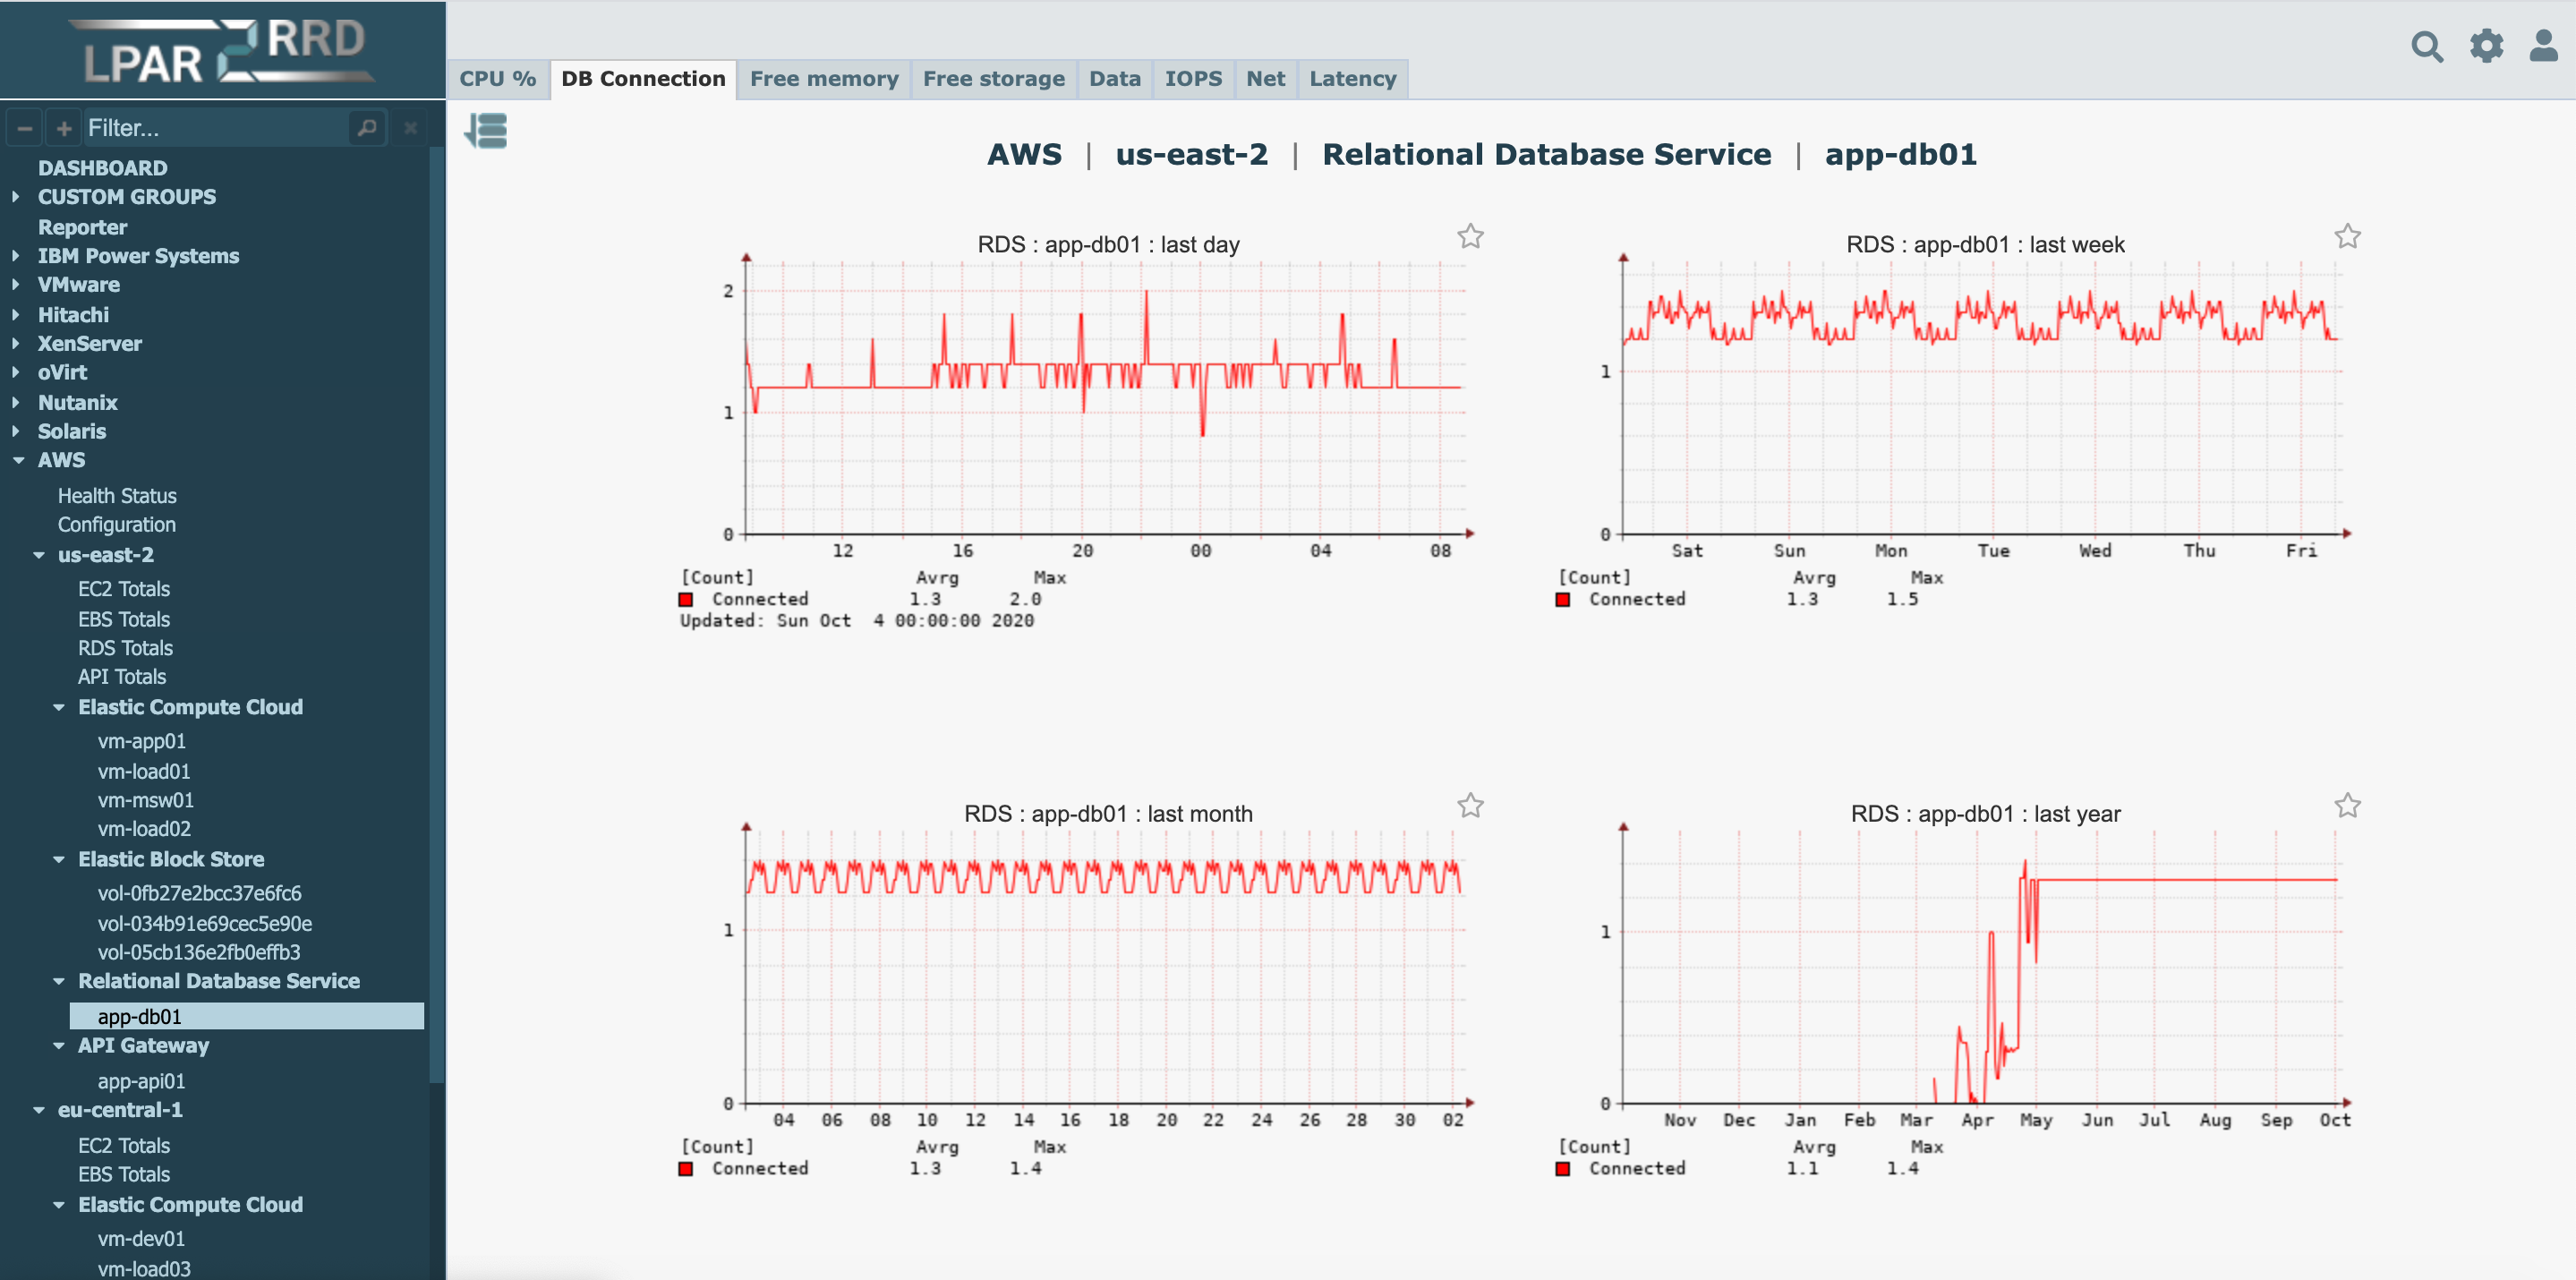 |
EC2 CPU% 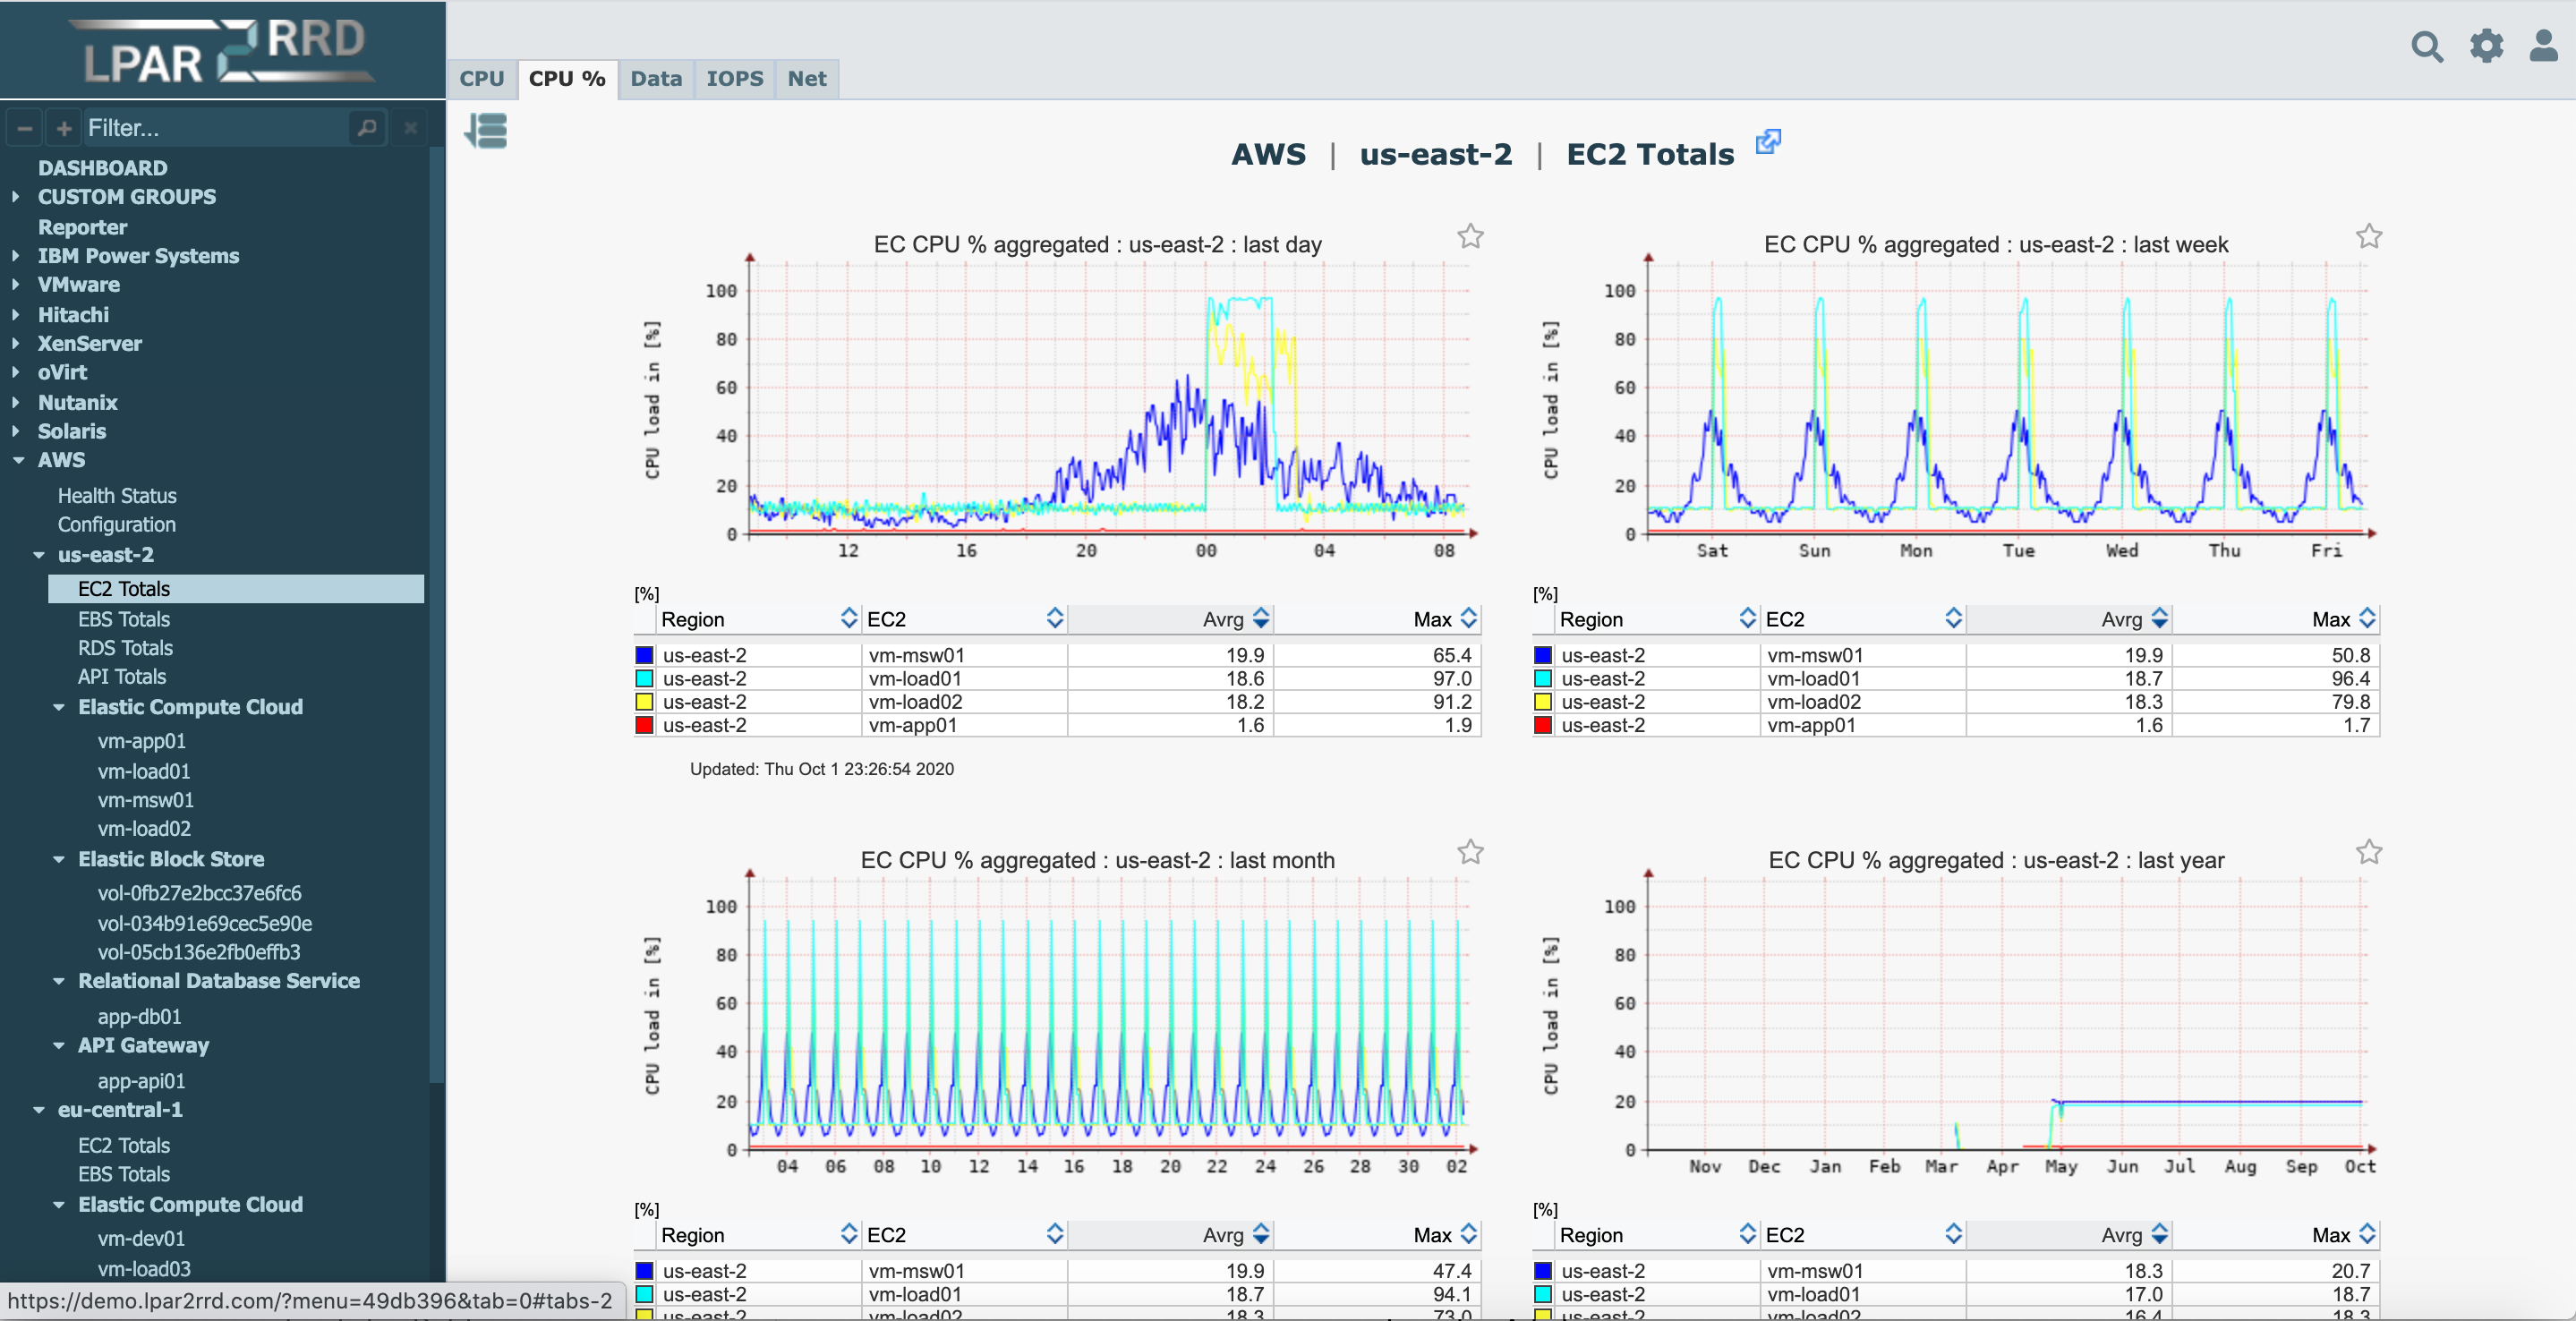 |
API Gateway 4xx errors 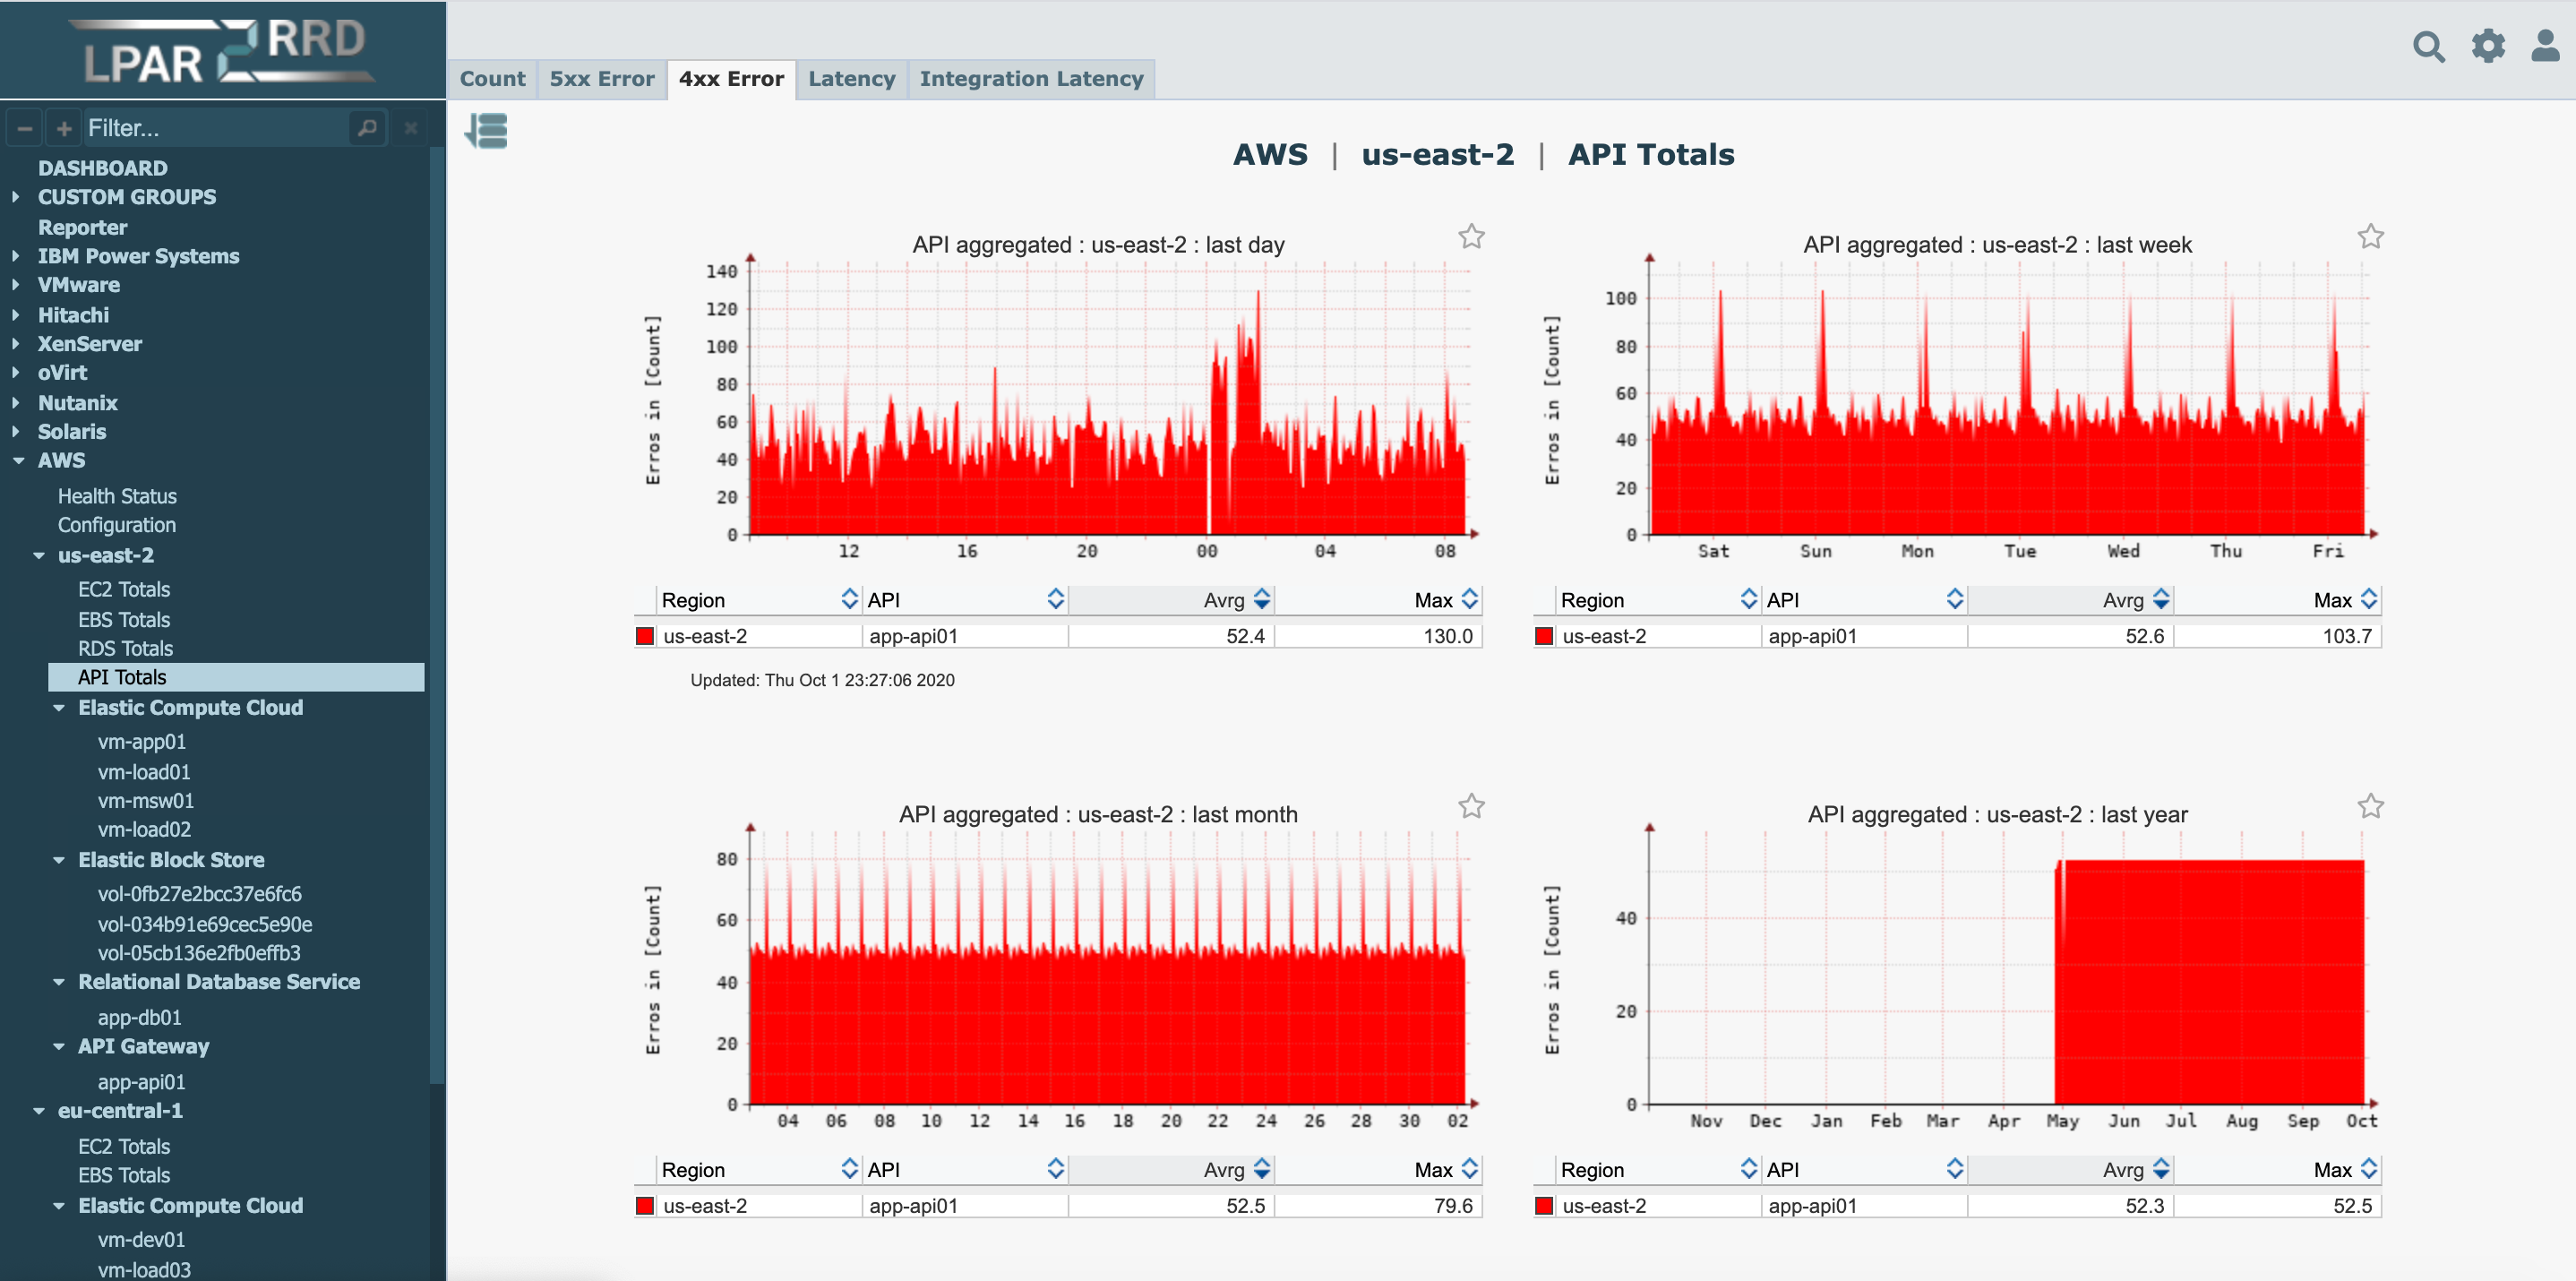 |
Supported services
- Virtual Machines
Collected Metrics
-
Virtual Machine
- CPU %
- Data
- IOPS
- Net
- Memory*
* with Azure Monitor Agent
You can see implementation on Free Demo
Examples
Configuration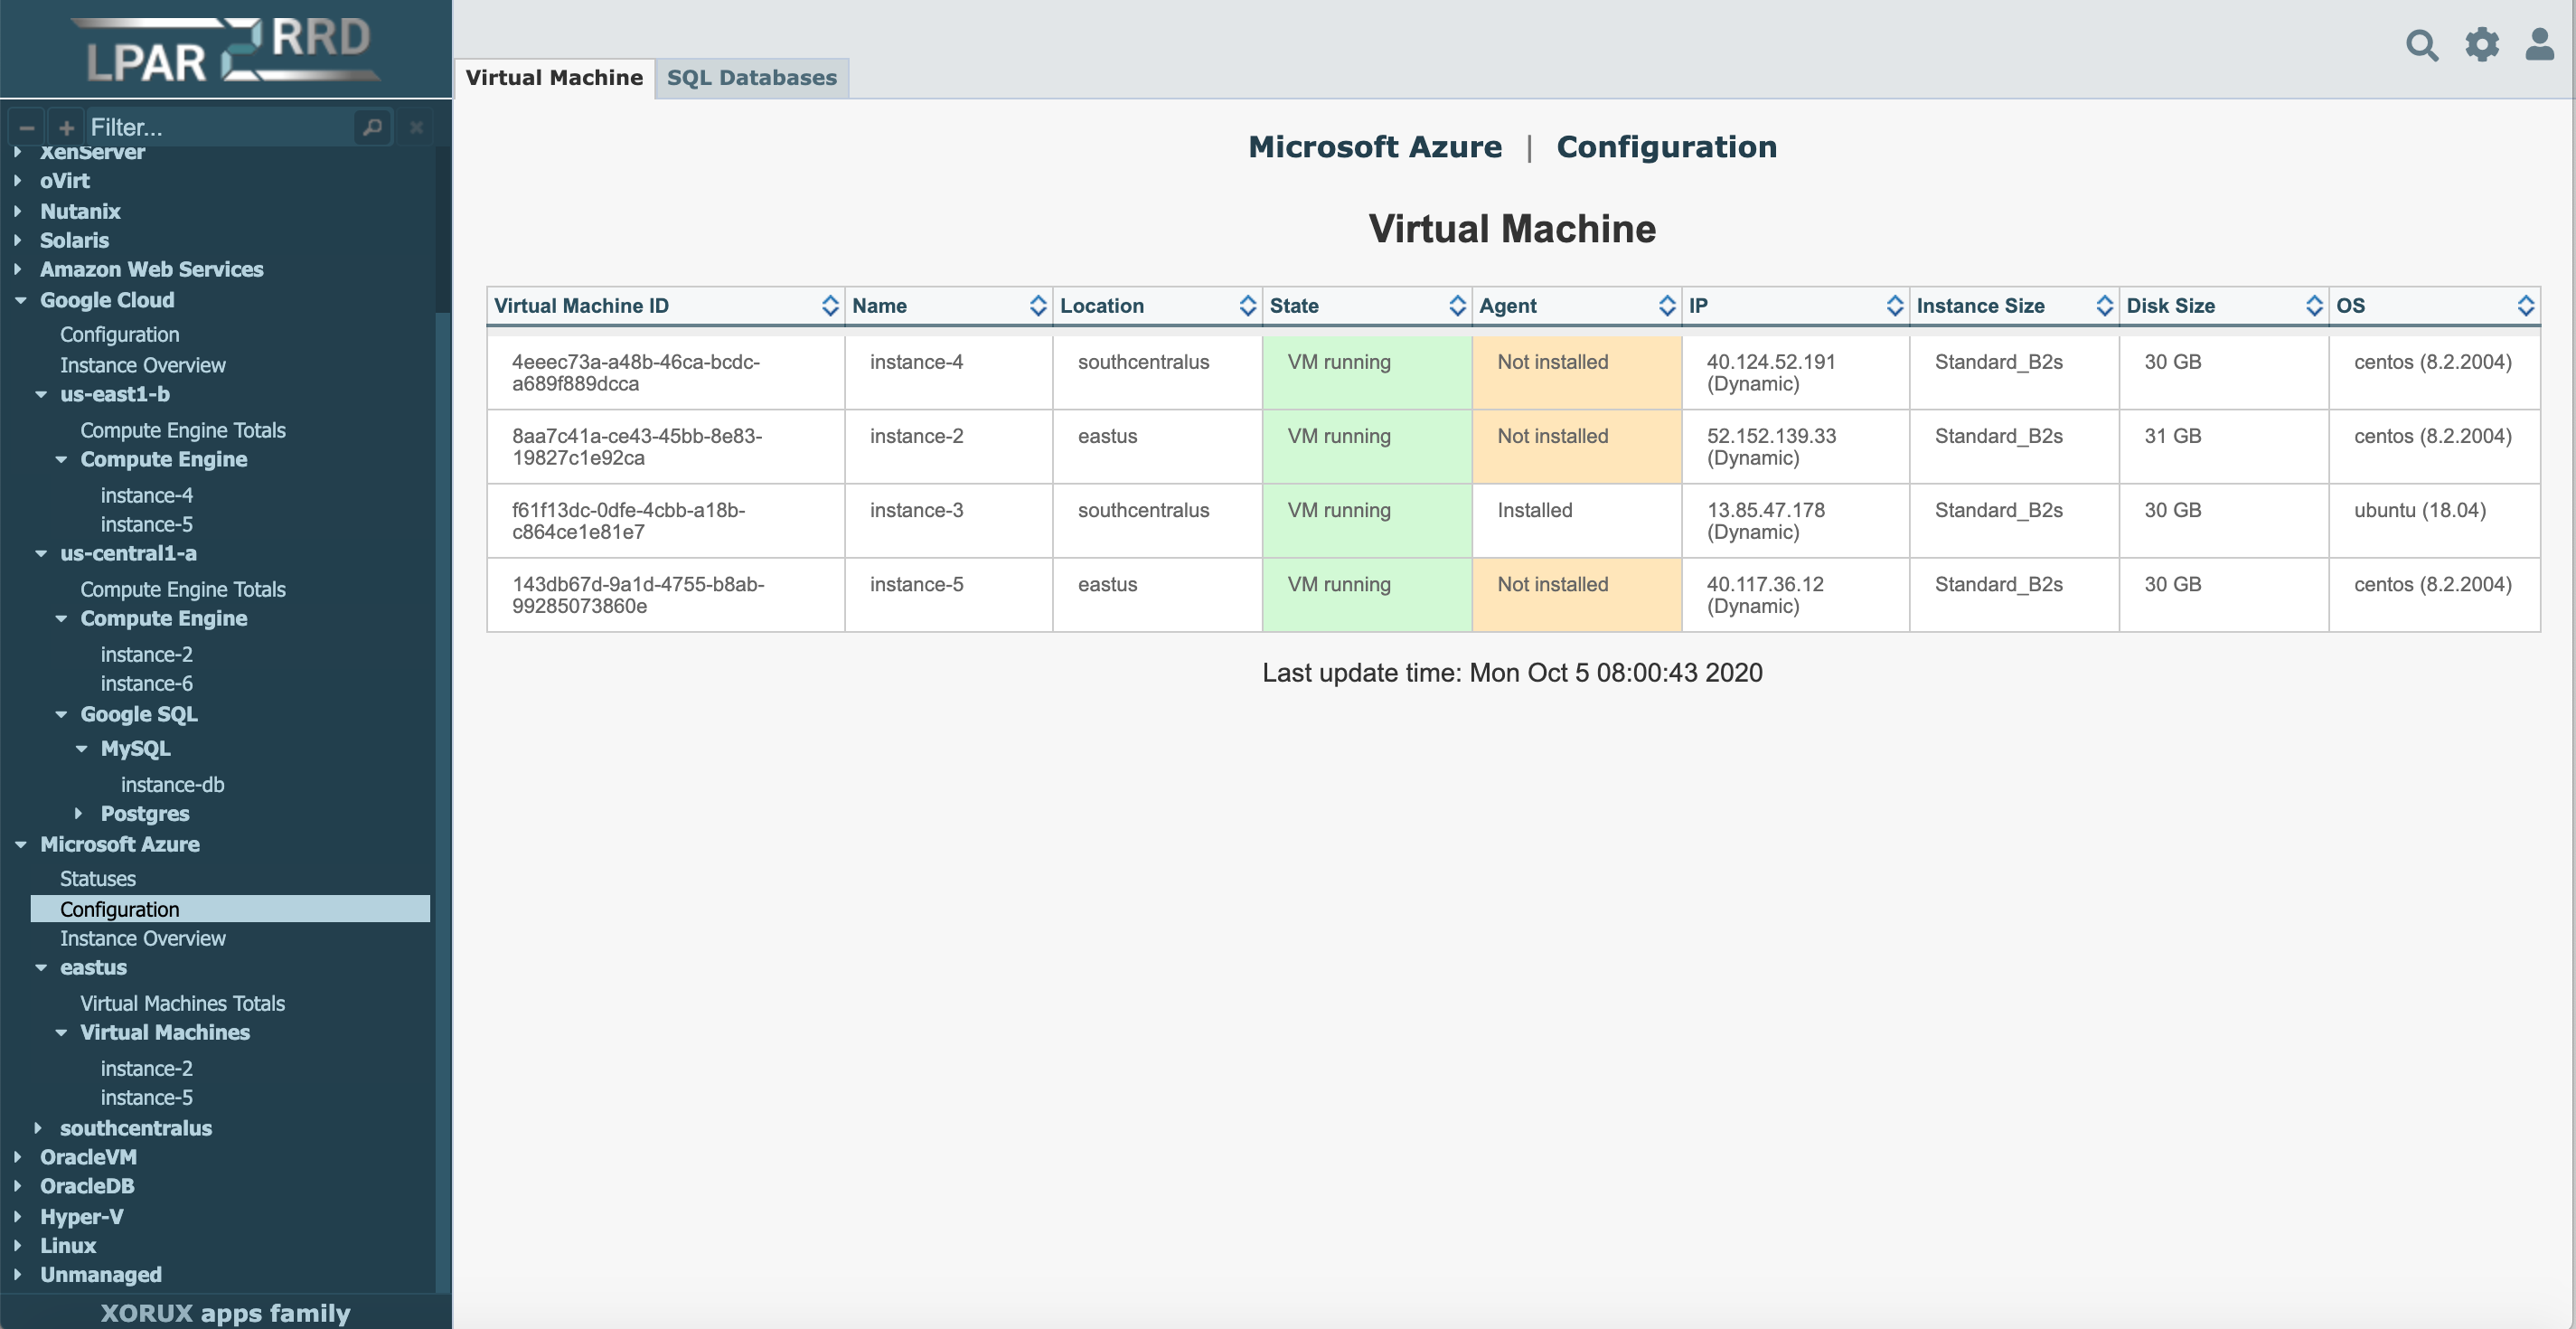 |
VM CPU% 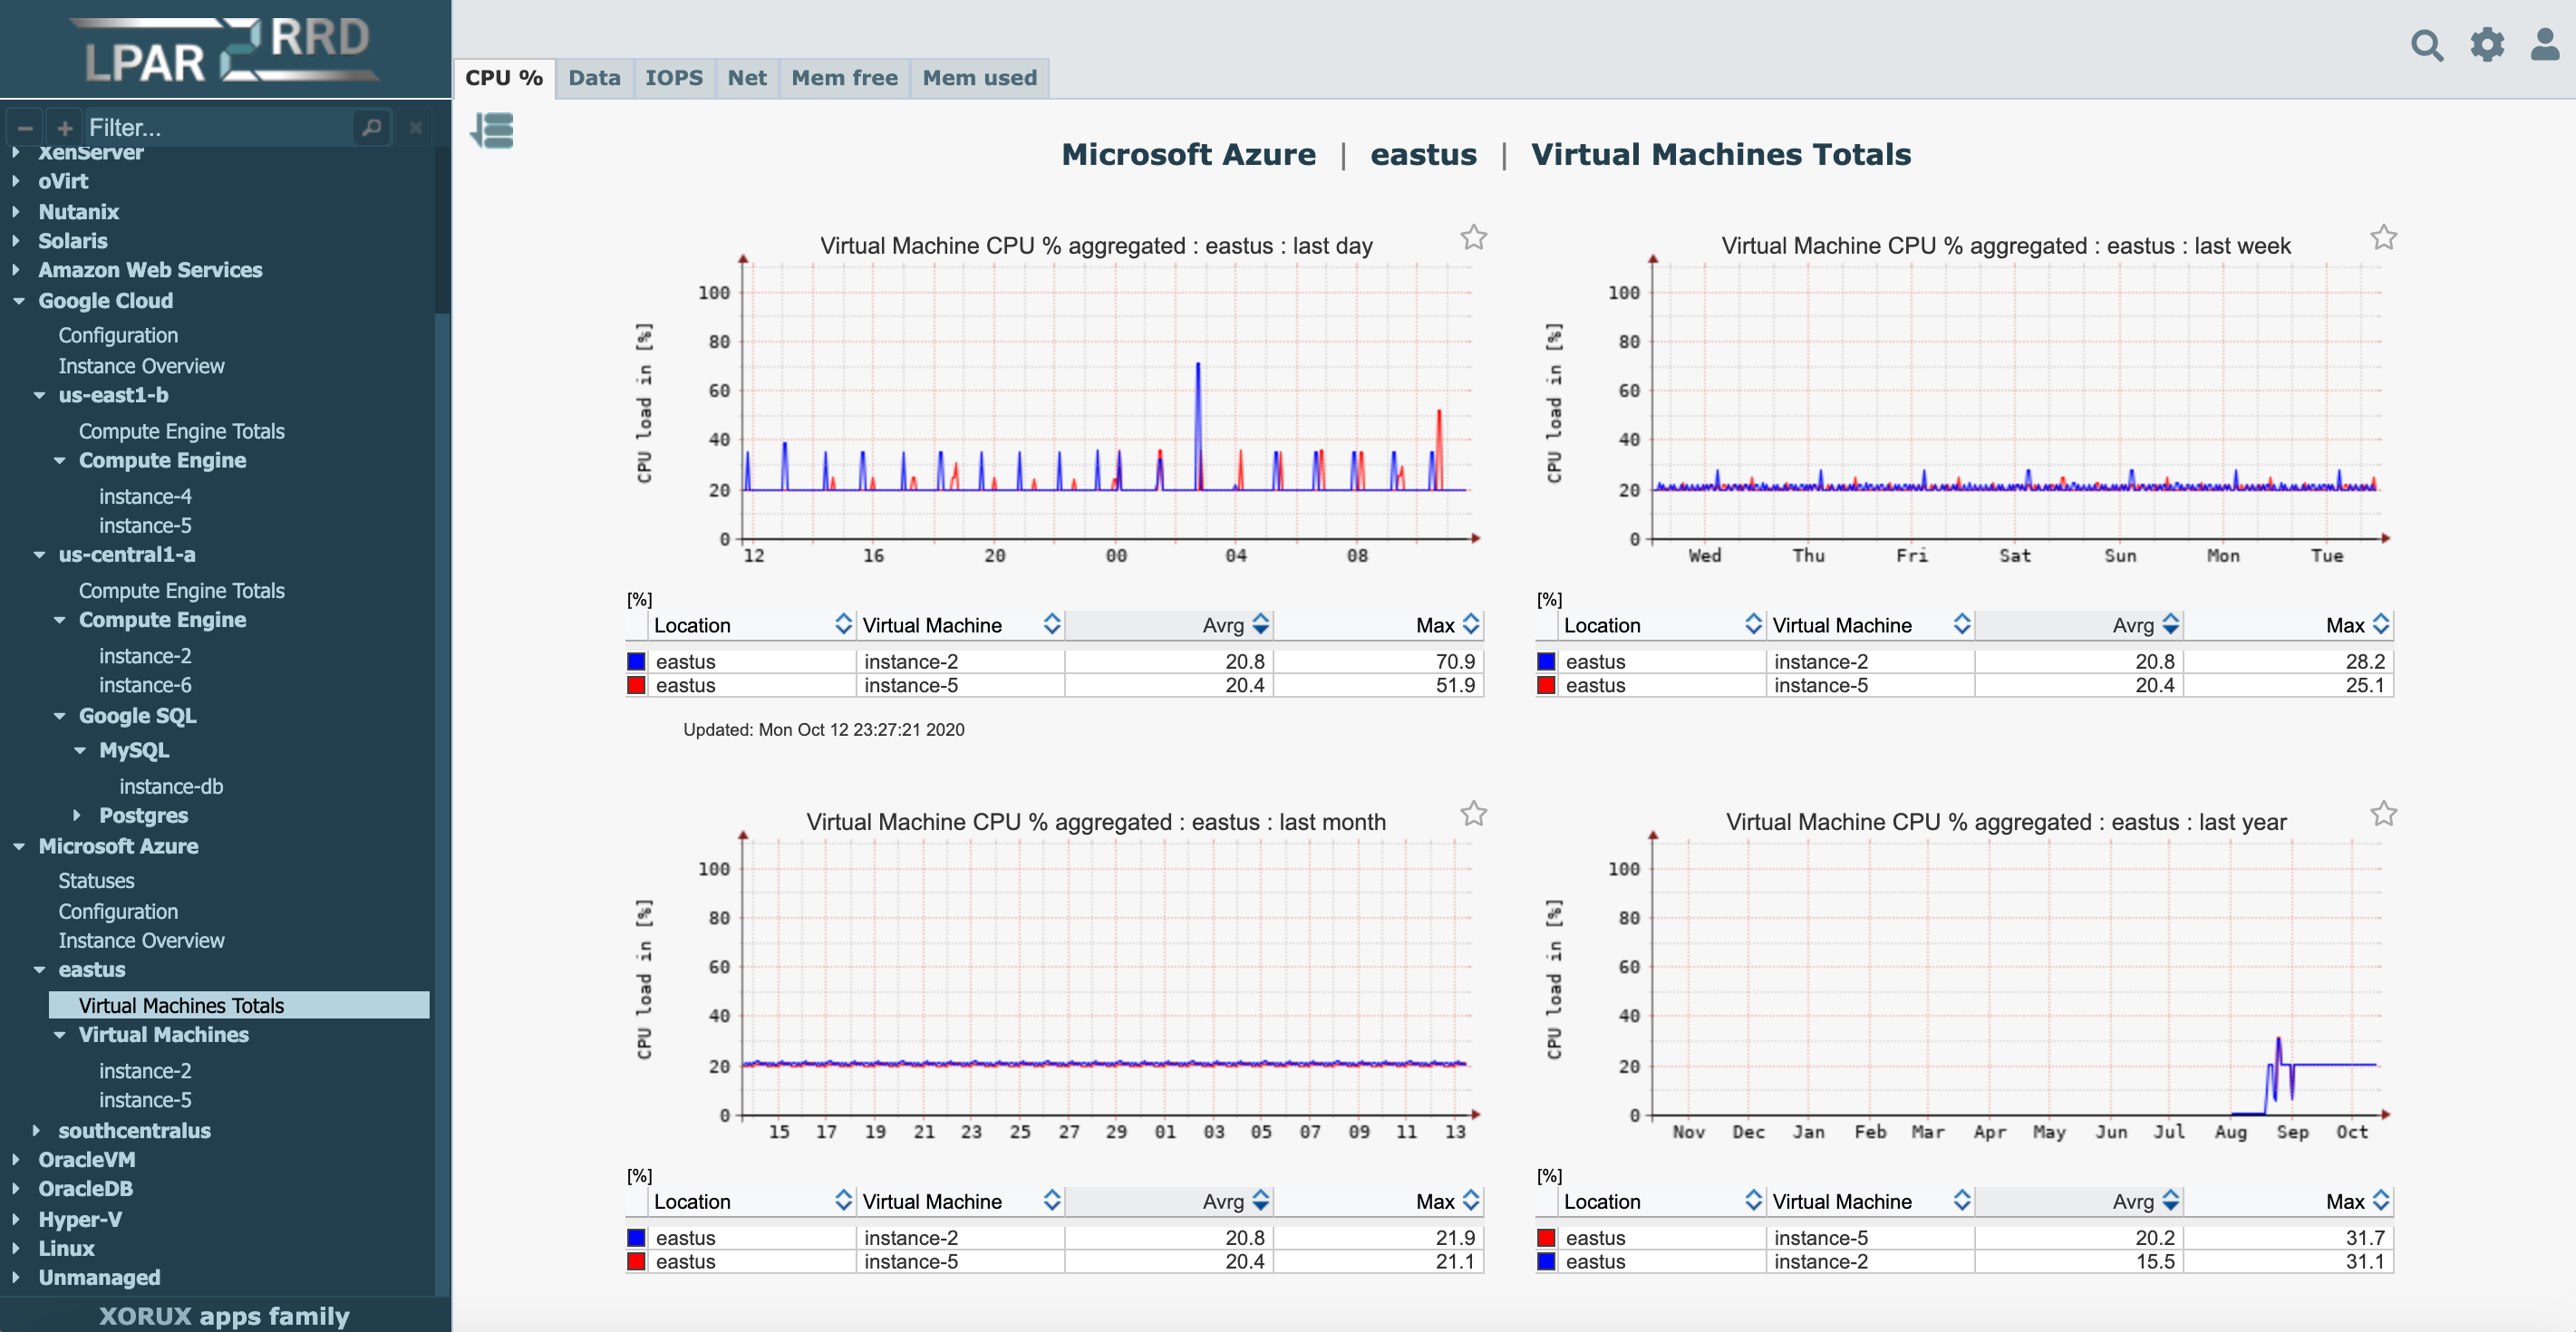 |
VM Data 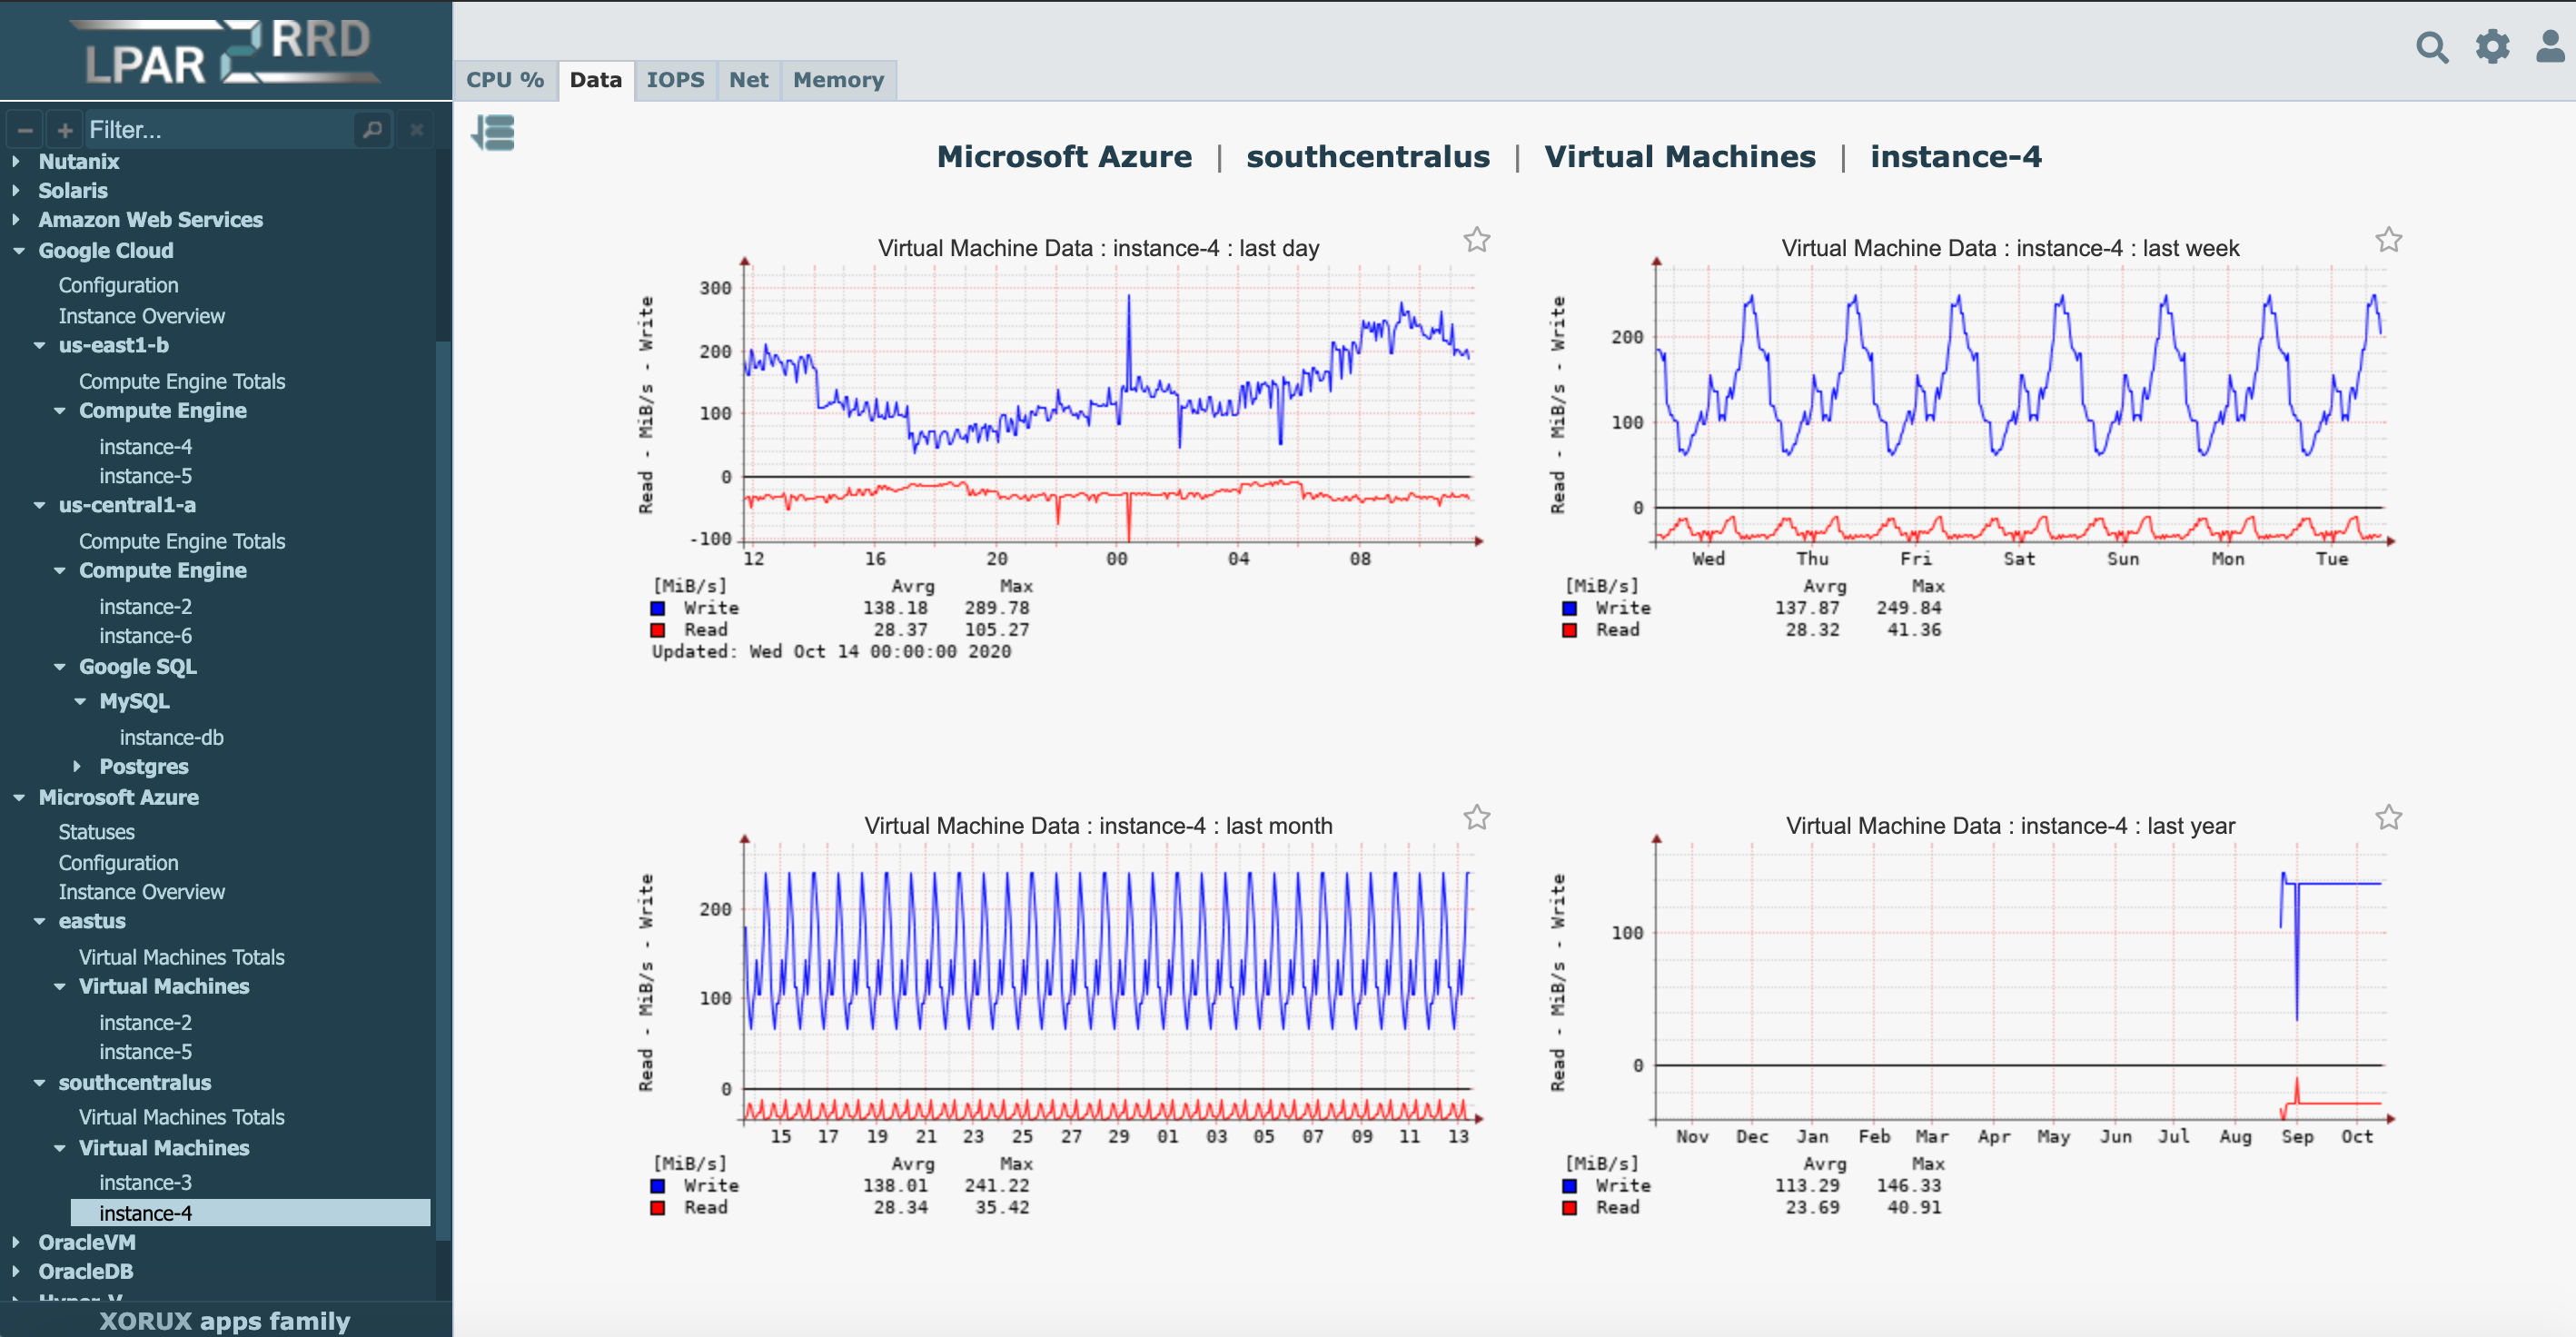 |
| Subsystem | Metric | Database | Member |
|---|---|---|---|
| Health Status | yes | ||
| Configuration | Main | yes | |
| Size | yes | ||
| Members | yes | ||
| Agents | Agents max | yes | yes |
| Pooled | yes | yes | |
| Associated | yes | yes | |
| Coordinated | yes | yes | |
| Registered | yes | yes | |
| Idle | yes | yes | |
| Stolen | yes | yes | |
| Locks | Held | yes | yes |
| Waiting | yes | yes | |
| Escals | yes | yes | |
| Timeouts | yes | yes | |
| Deadlocks | yes | yes | |
| IO | Logical | yes | yes |
| Physical | yes | yes | |
| Direct | yes | yes | |
| Latency | Direct | yes | yes |
| Pool | yes | yes | |
| Log | yes | yes | |
| Session | Max conns | yes | yes |
| Conns/s | yes | yes | |
| Secondary conns/s | yes | yes | |
| Current conns | yes | yes | |
| Rows | Total | yes | yes |
| Internal | yes | yes | |
| Network | yes | yes | |
| Network | Remote | yes | yes |
| Local | yes | yes | |
| FCM | yes | yes | |
| SQL query | Cache inserts | yes | yes |
| Cache lookups | yes | yes | |
| Commits | yes | yes | |
| Rollbacks | yes | yes | |
| Waits | Total | yes | yes |
| IO | yes | yes | |
| Network | yes | yes | |
| Ratio | Buffer hit | yes | yes |
| CPU time | yes | yes | |
| Log hit | yes | yes |
| Subsystem | Metric | Standalone |
|---|---|---|
| Configuration | DB size | yes |
| Main | yes | |
| BG writer | Buffers | yes |
| Checkpoints | yes | |
| Throughput | Blocks | yes |
| Tuples | yes | |
| Temp | yes | |
| Sessions | Active | yes |
| Disabled | yes | |
| Fastpath | yes | |
| Idle | yes | |
| Locks | Held | yes |
| Awaited | yes | |
| Deadlocks | yes | |
| SQL query | User | yes |
| Cursors | yes | |
| Wait events | LWLockNamed | yes |
| LWLLockTranche | yes | |
| Lock | yes | |
| BufferPin | yes | |
| Vacuum | Phase | yes |
| Ratio | Cache hit | yes |
| Commit | yes |
| Subsystem | Metric | Standalone | RAC |
|---|---|---|---|
| Health status | yes | yes | |
| Configuration | Overall | yes | yes |
| SGA | yes | yes | |
| Tablespace size | yes | yes | |
| Installed DB components | yes | yes | |
| Upgrade, Downgrade info | yes | yes | |
| PSU, patches | yes | yes | |
| Interconnect | Traffic MB/sec | yes | |
| Configuration | yes | ||
| Datafiles | Performance stats (table) | yes | yes |
| Global Cache | get time | yes | |
| block a sec | yes | ||
| block 2 way/3 way | yes | ||
| block bussy/congest, grant congest | yes | ||
| block lost, blocks corrupted/lost, retry | yes | ||
| split, bussy release, disk read, multiblock request, grant busy, busy acquire | yes | ||
| remaster | yes | ||
| CPU | Host CPU utilization | yes | yes |
| CPU core Per Sec | yes | yes | |
| CPU core Per Txn | yes | yes | |
| IO | Total | yes | yes |
| Physical Read | yes | yes | |
| Physical Write | yes | yes | |
| Data | Total | yes | yes |
| Redo | yes | yes | |
| Physical Read | yes | yes | |
| Physical Write | yes | yes | |
| SGA data | Block Changes | yes | yes |
| Logical Read | yes | yes | |
| Session | current logons count, active serial sessions, logons per sec, active paralel sessions, avg active sessions | yes | yes |
| SQL query | User | yes | yes |
| Cursors | yes | yes | |
| Hard Parse | yes | yes | |
| Executions | yes | yes | |
| Network | MB/sec | yes | yes |
| Ratio | Buffer Cache Hit | yes | yes |
| PGA Cache Hit | yes | yes | |
| Memory Sorts | yes | yes | |
| Soft Parse | yes | yes | |
| CPU Time | yes | yes | |
| Wait Time | yes | yes | |
| Latency | DB files read | yes | yes |
| DB files write | yes | yes | |
| LOG files write | yes | yes | |
| Flashback latency | yes | yes | |
| Wait class | Average wait FG | yes | yes |
| Average wait | yes | yes | |
| Services | Physical Writes | yes | yes |
| Physical Reads | yes | yes |
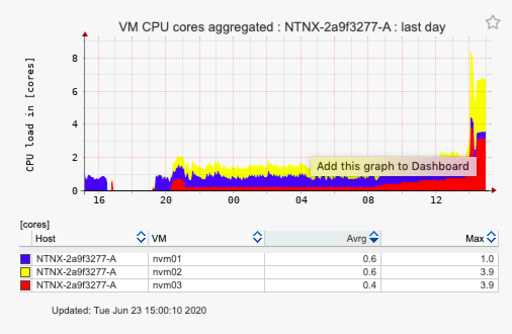
| Pool | Host | VM | |
|---|---|---|---|
| CPU | 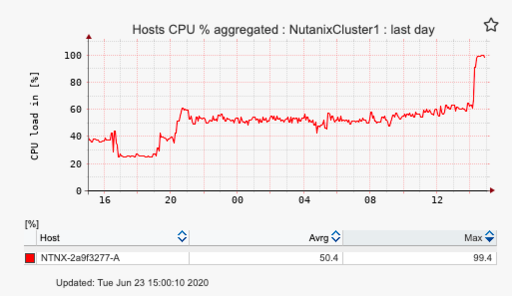 |
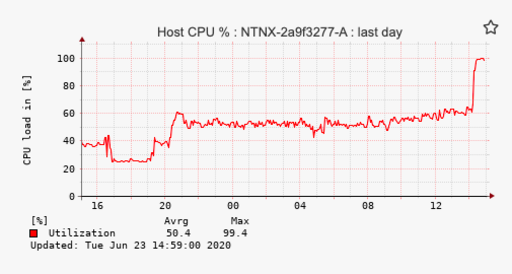 |
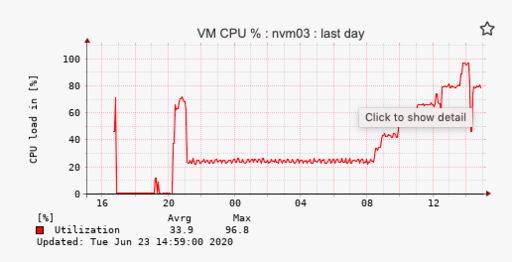 |
| CPU Aggregated | 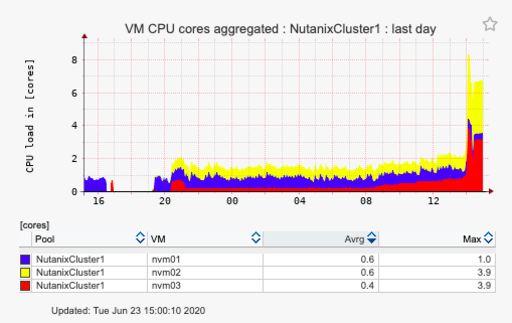 |
 |
|
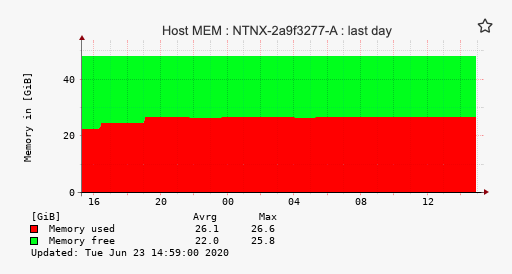
| Memory | 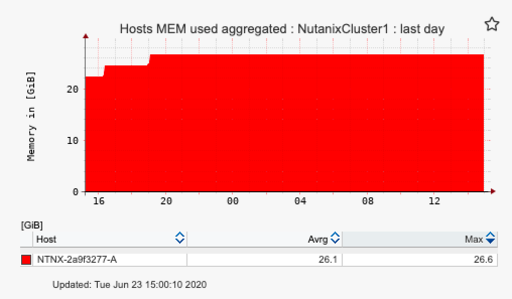 |
 |
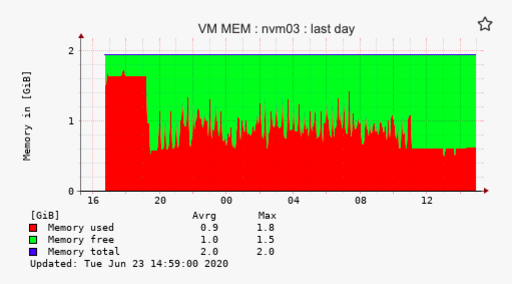 |
| Memory Aggregated | 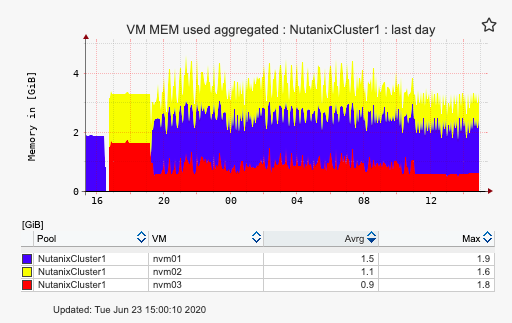 |
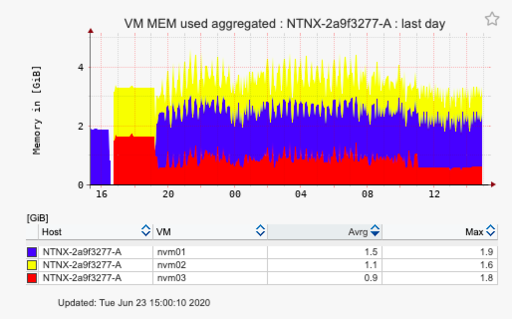 |
|
| Network | 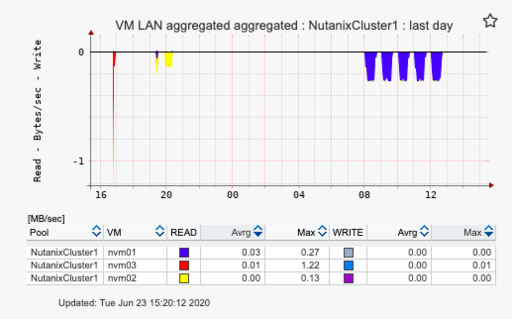 |
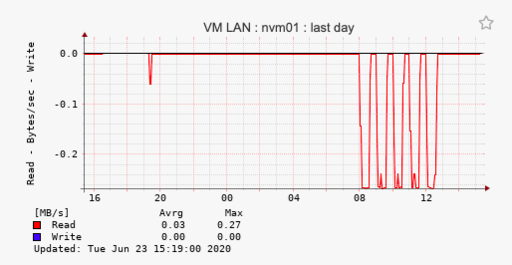 |
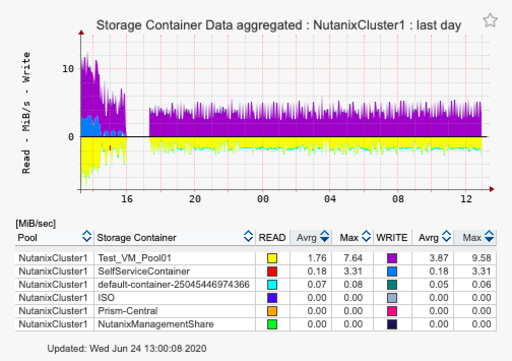
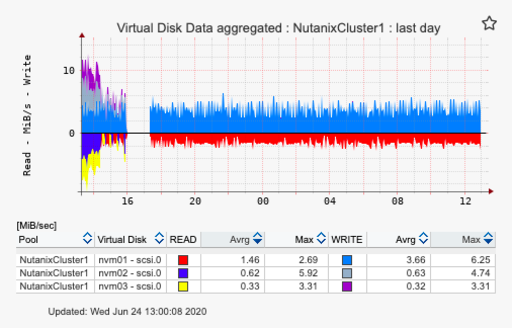
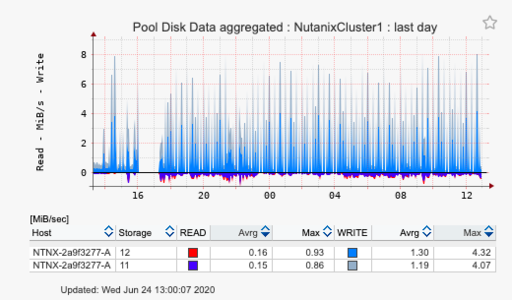
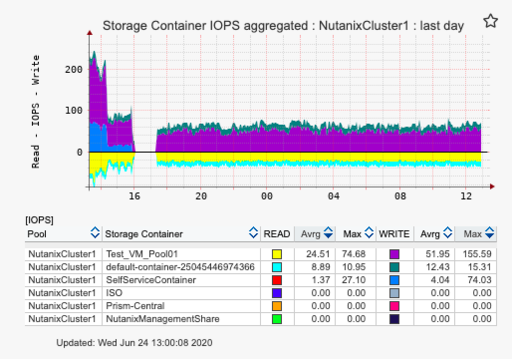
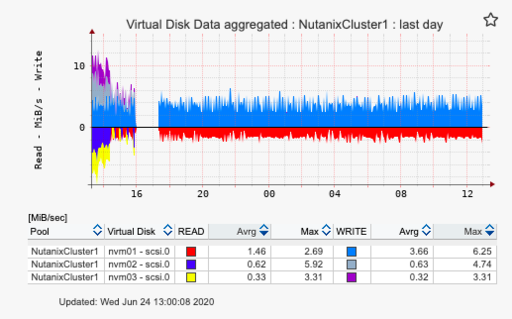
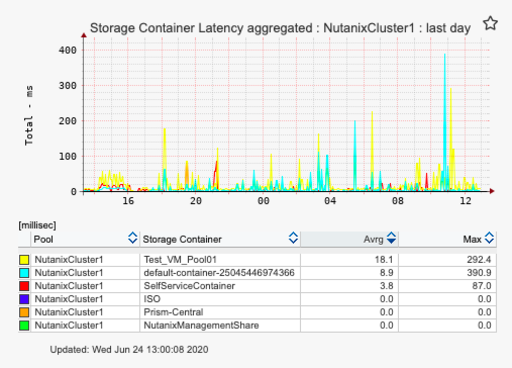
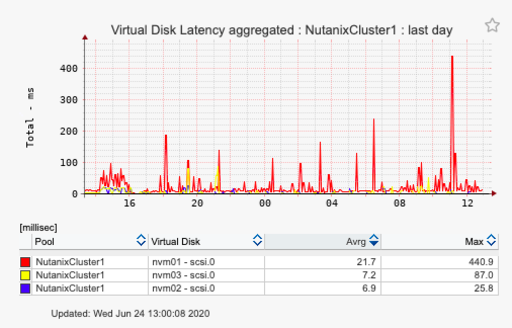
| Storage Pool | Storage Container | Virtual Disk | Physical Disk | |
|---|---|---|---|---|
| Data | 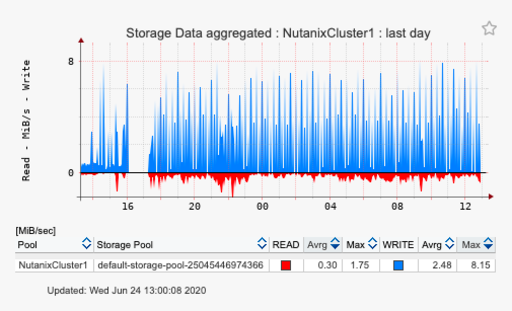 |
 |
 |
 |
| IOPS | 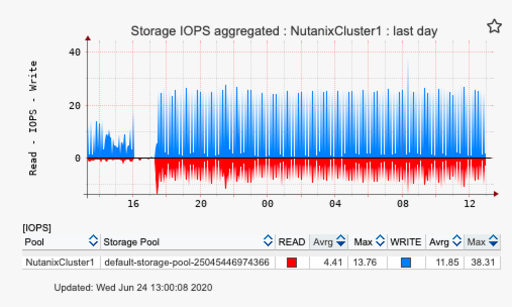 |
 |
 |
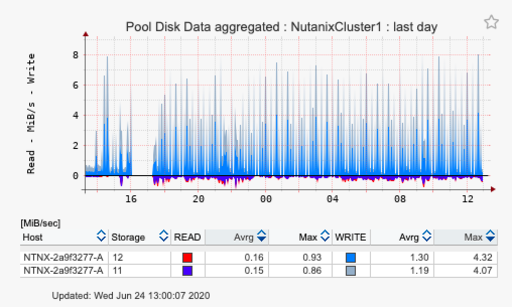 |
| Latency | 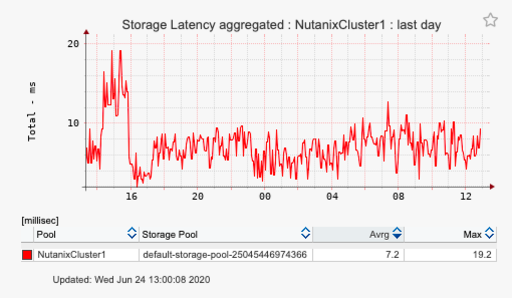 |
 |
 |
 |
|
Manager |
Cluster |
Server |
VM |
|
|---|---|---|---|---|
| CPU | 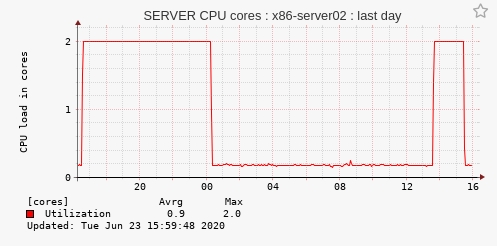 |
 |
||
| CPU in % | 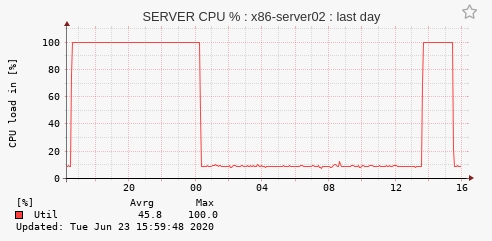 |
 |
||
| CPU Aggregated | 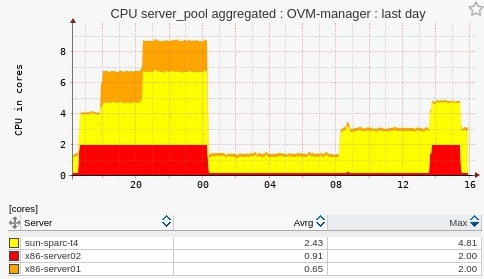 |
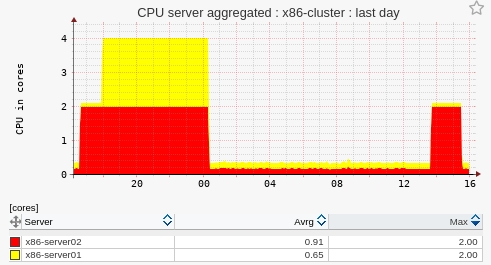 |
||
| Memory | 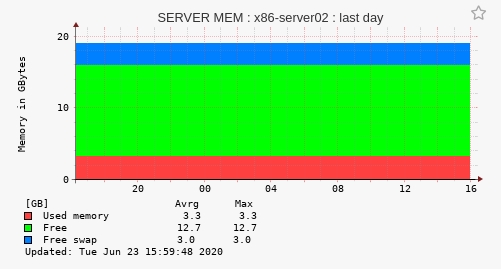 |
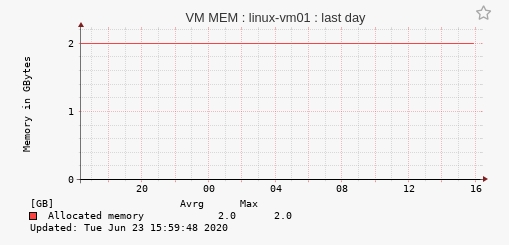 |
||
| Memory in % | 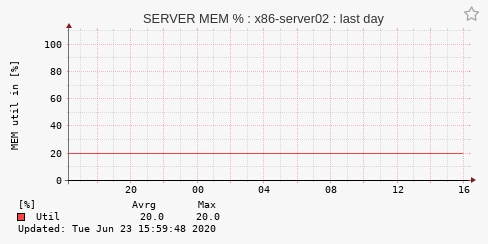 |
|||
| Memory Aggregated | 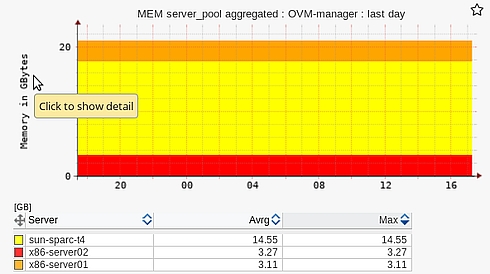 |
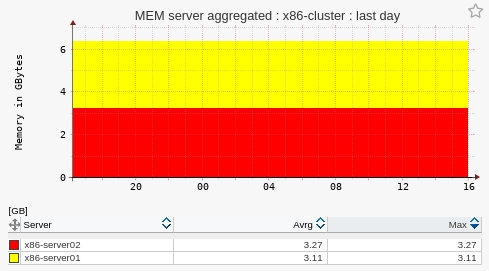 |
||
| Disk Usage | 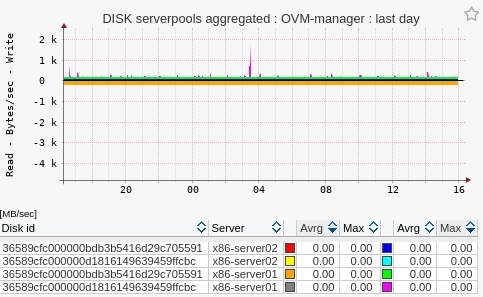 |
 |
 |
 |
| Network | 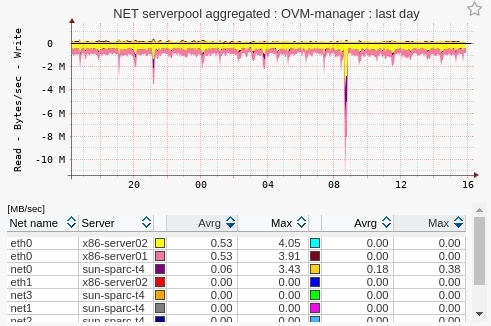 |
 |
 |
 |
|
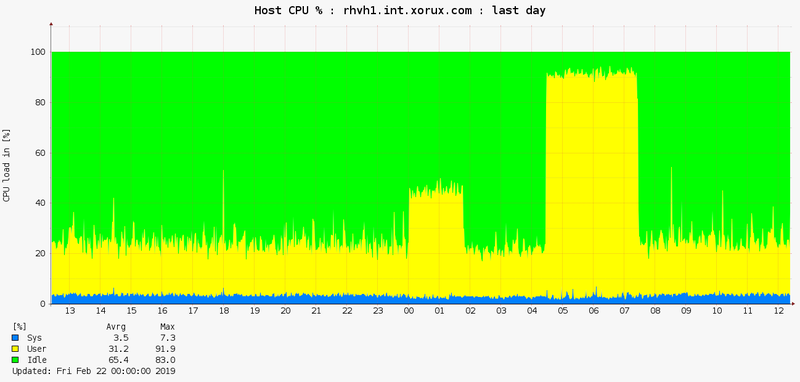
Cluster |
Host |
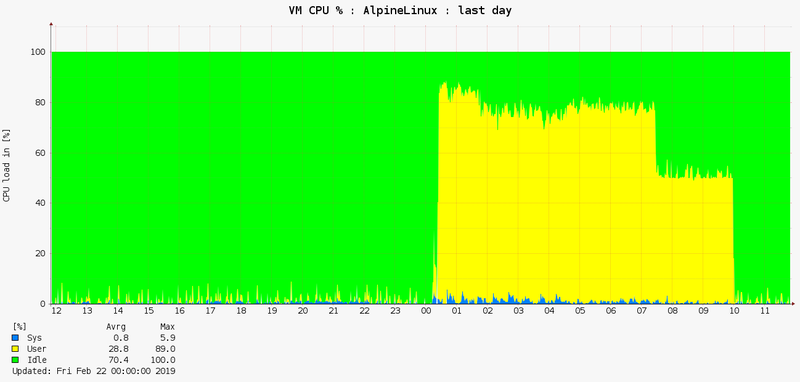
VM |
|
|---|---|---|---|
| CPU | 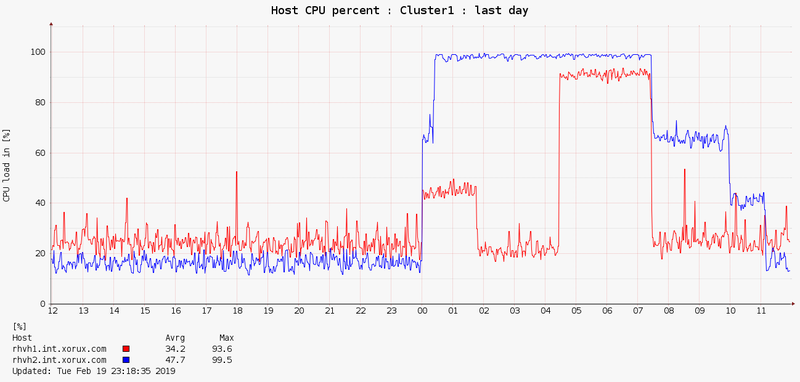 |
 |
 |
| CPU Aggregated | 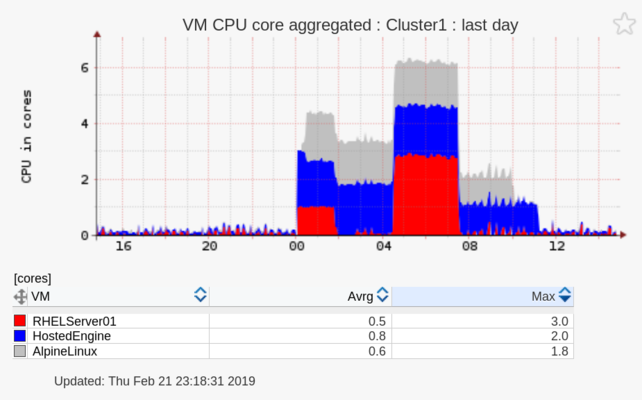 |
||
| Memory | 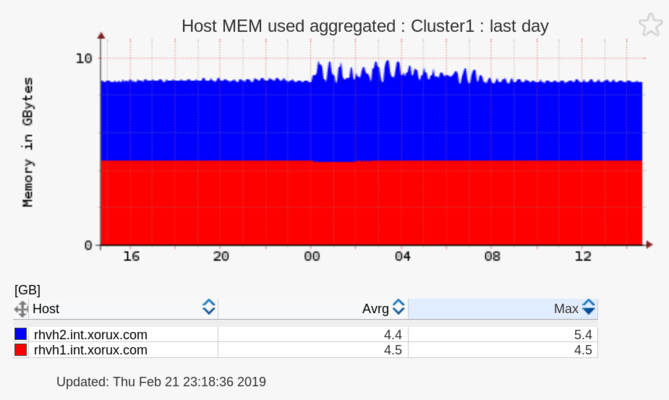 |
 |
 |
| Memory Aggregated | 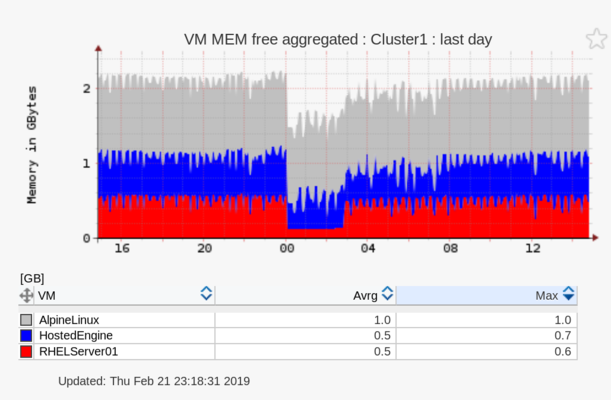 |
||
| Storage | 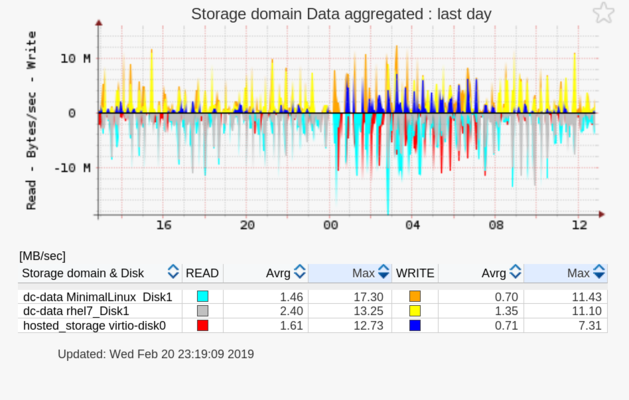 |
 |
|
| Network | 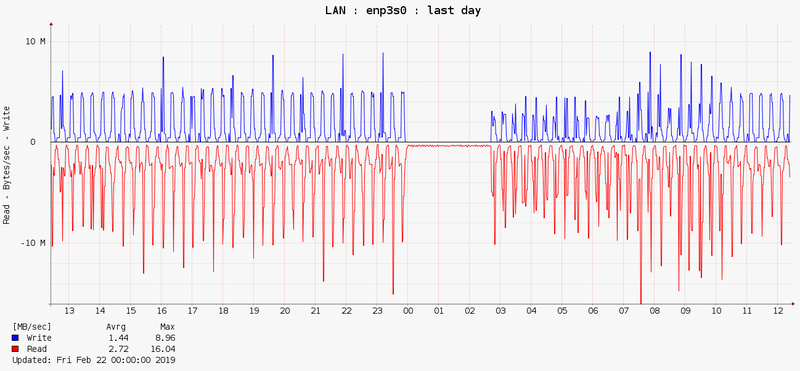 |
 |
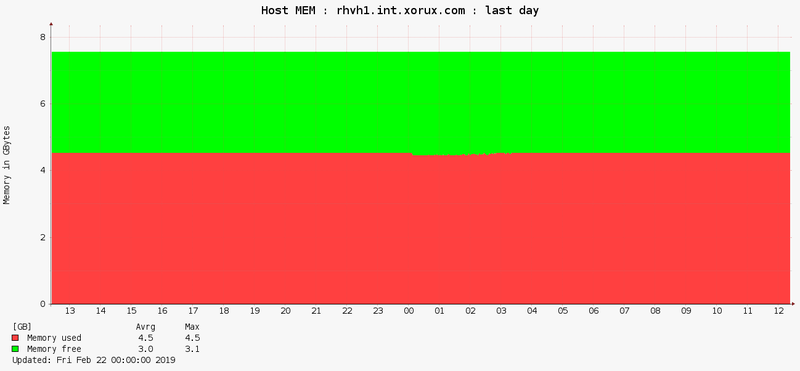
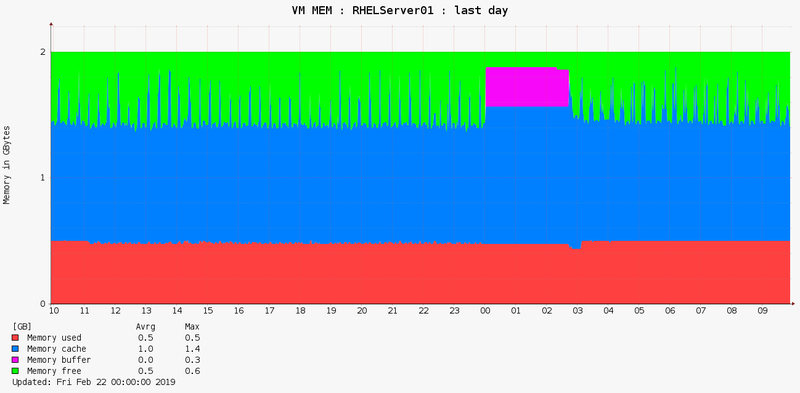
Monitored components
- Cluster
- Host
- VM
- Storage Domain
Monitored metrics
- CPU
- Memory utilization
- LAN throughput MB/sec
- Storage space GB
- Storage throughput MB/sec
- Storage latency
Collected data set can be enhanced about OS agent which brings these additional metrics:
| OS CPU | CPU sys, user, IO wait |
| CPU queue | Load avrg, Blocked processes |
| JOB | CPU, Memory |
| Memory utilization | Used, FS cache |
| LAN (ethernet adapters) | MB/sec, packet count |
| SAN (FC,vSCSI adapters) | MB/sec, packets/sec, Latency |
| Paging space utilization | Usage in % |
| Paging rate | MB/sec |
| Filesystem usage | Usage in %, GB |
|
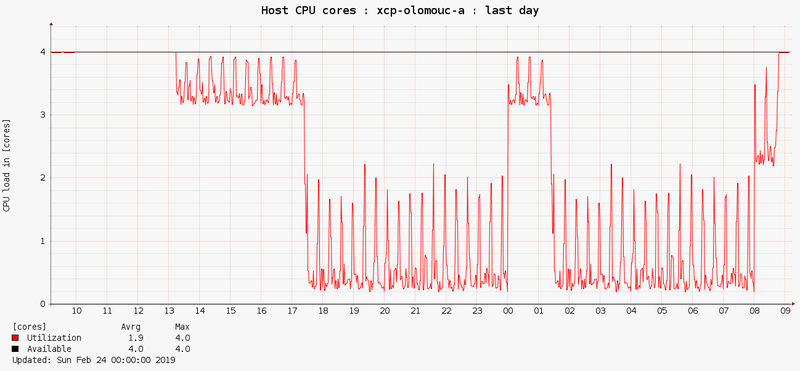
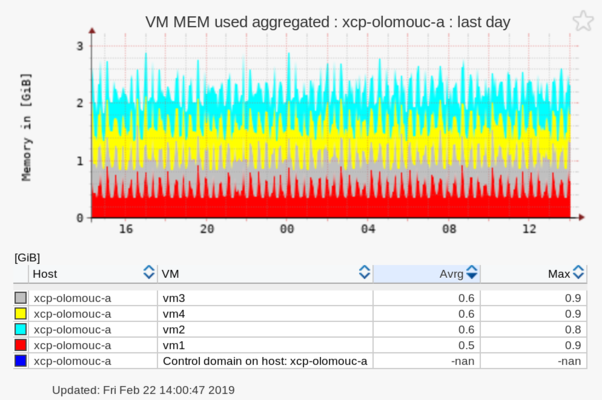
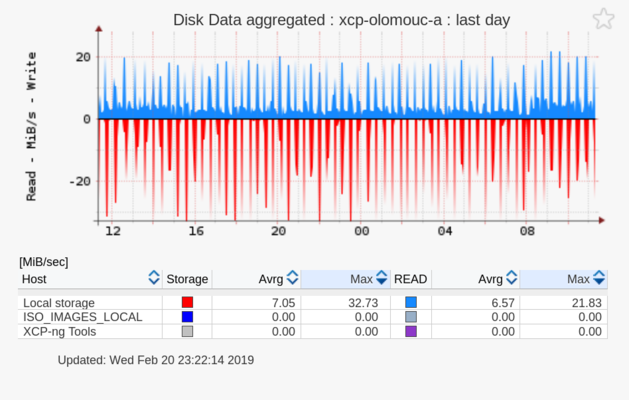
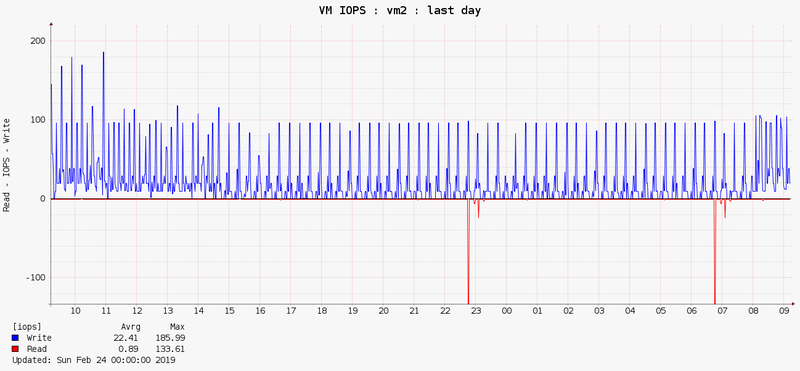
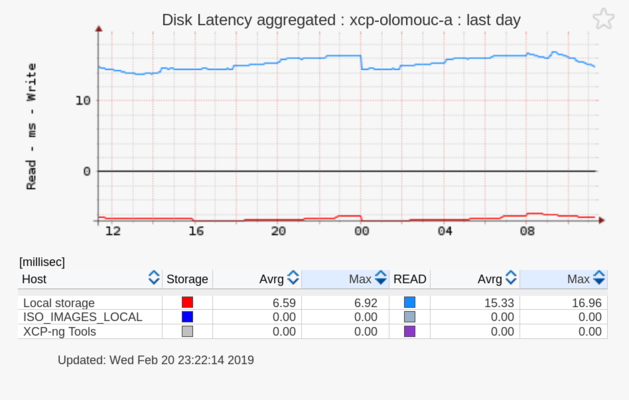
Pool |
Host |
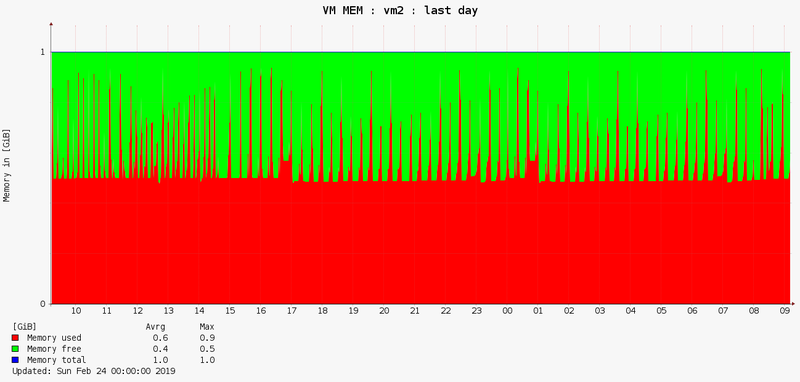
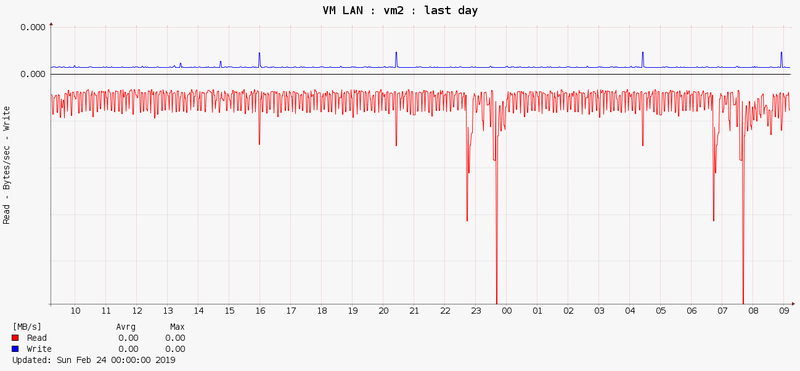
VM |
|
|---|---|---|---|
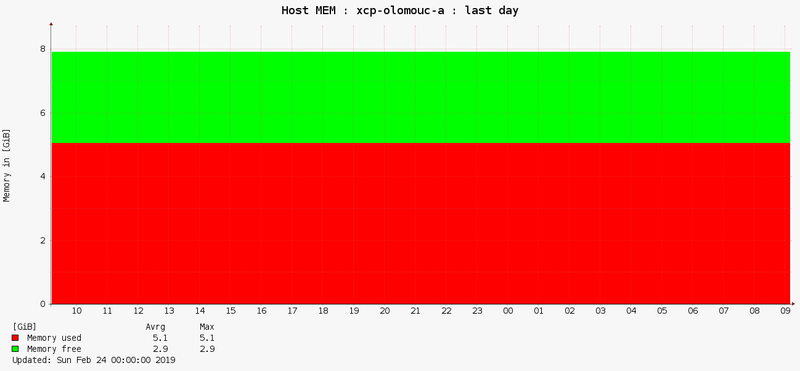
| CPU | 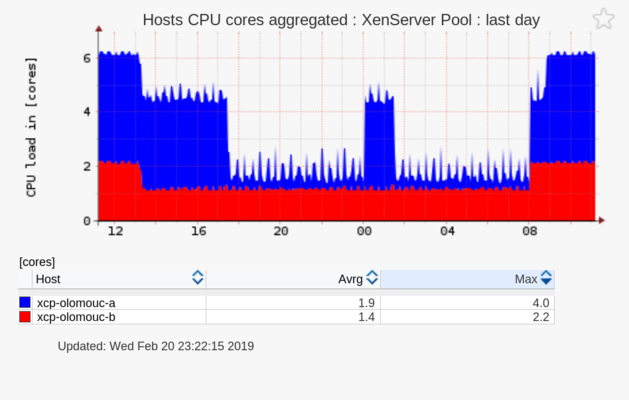 |
 |
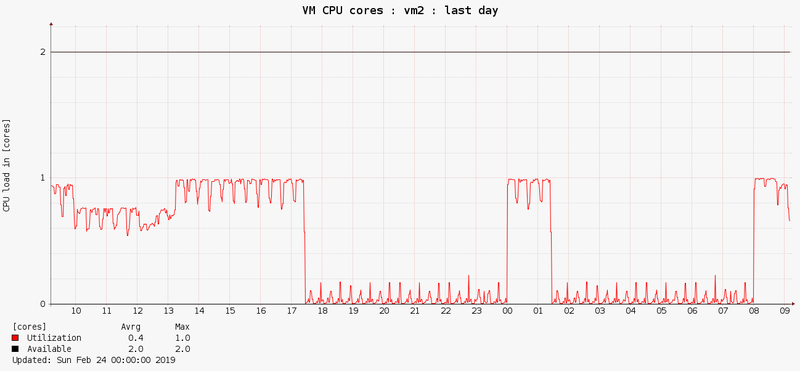 |
| CPU Aggregated | 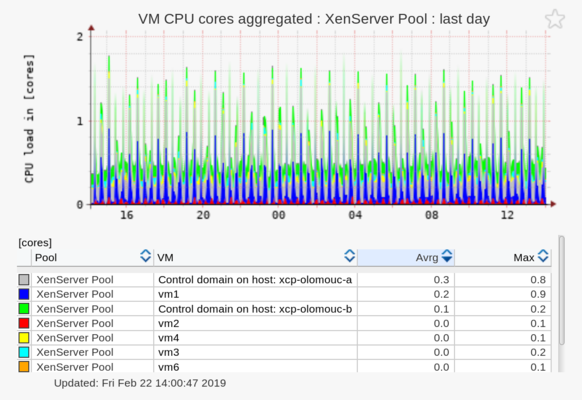 |
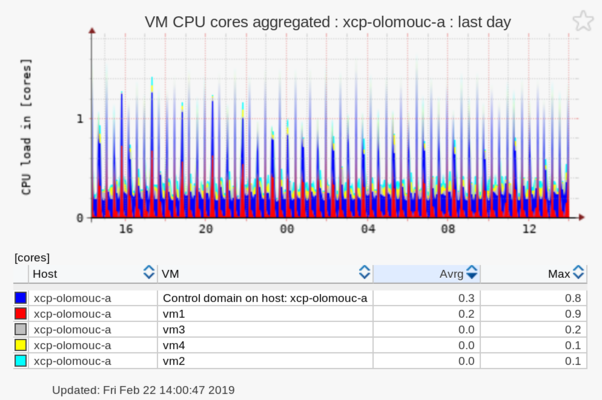 |
|
| Memory | 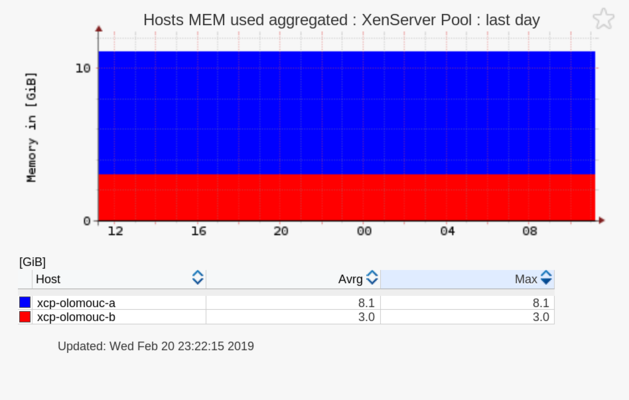 |
 |
 |
| Memory Aggregated | 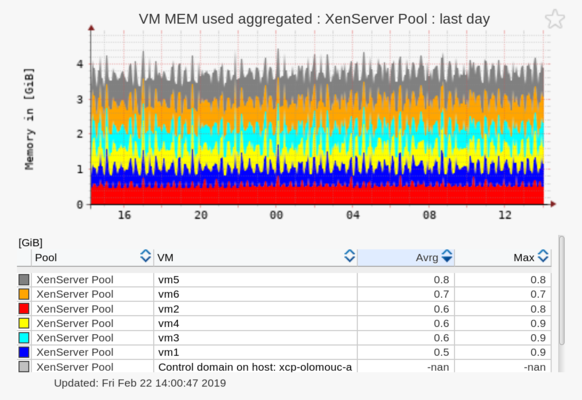 |
 |
|
| Disk Usage | 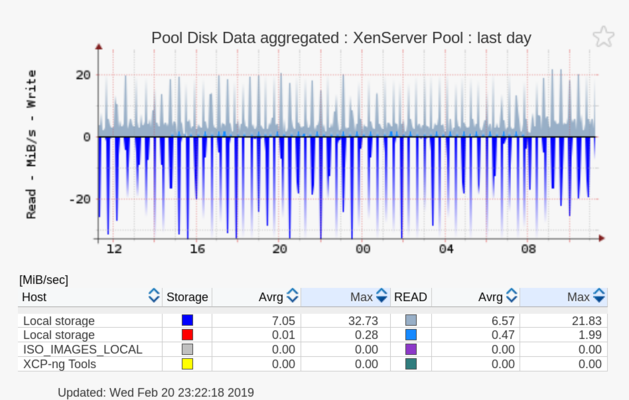 |
 |
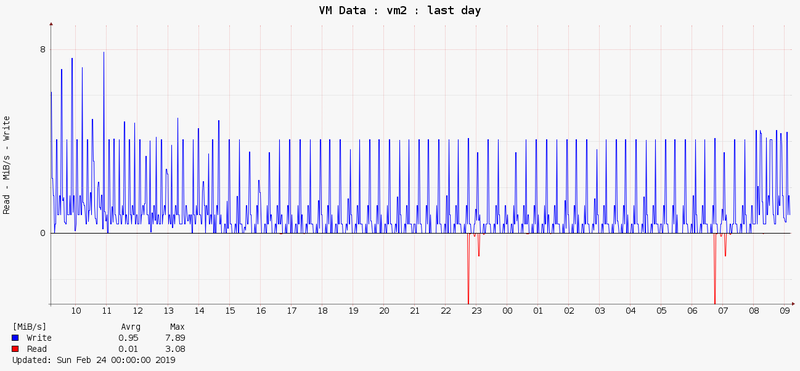 |
| Disk IOPS | 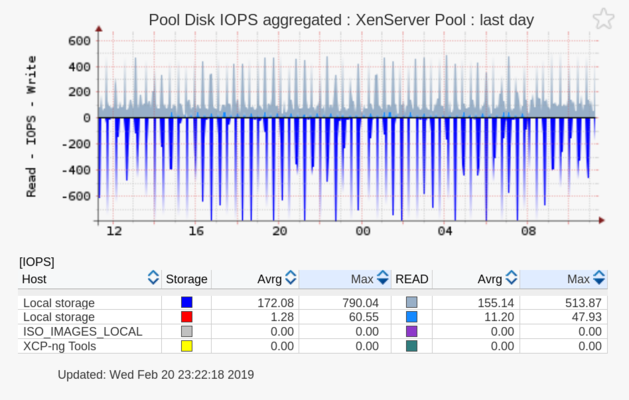 |
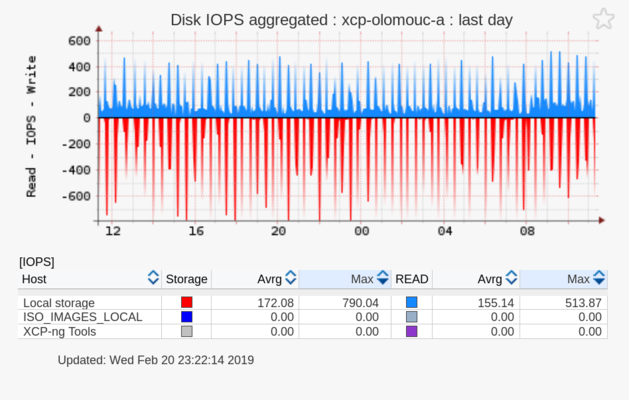 |
 |
| Disk Latency | 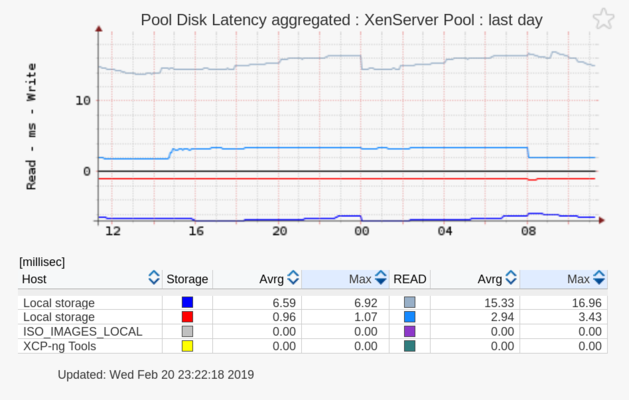 |
 |
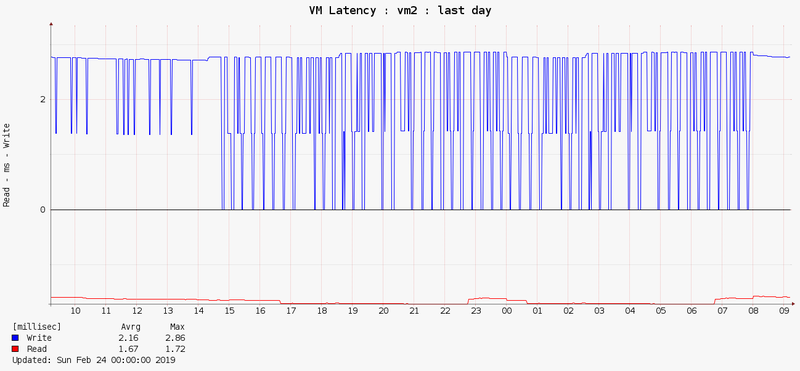 |
| Network | 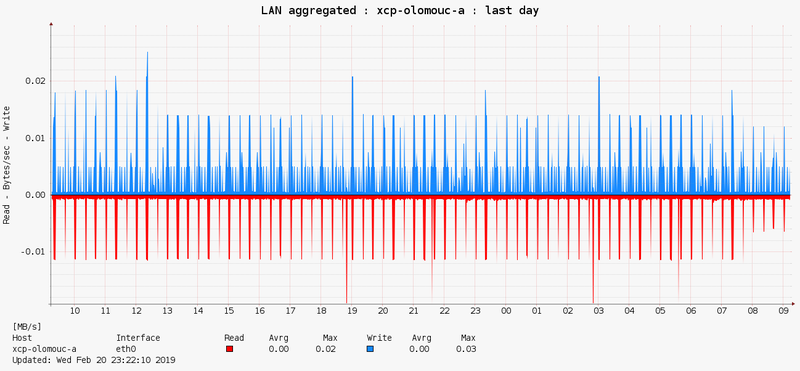 |
 |
Monitored components
- Host
- Pool
- VM
- Storage
Monitored metrics
- CPU
- Memory utilization
- LAN throughput MB/sec
- Storage throughput MB/sec
- Storage throughput IOPS
- Storage latency
Collected data set can be enhanced about OS agent which brings these additional metrics:
| OS CPU | CPU sys, user, IO wait |
| CPU queue | Load avrg, Blocked processes |
| JOB | CPU, Memory |
| Memory utilization | Used, FS cache |
| LAN (ethernet adapters) | MB/sec, packet count |
| SAN (FC,vSCSI adapters) | MB/sec, packets/sec, Latency |
| Paging space utilization | Usage in % |
| Paging rate | MB/sec |
| Filesystem usage | Usage in %, GB |
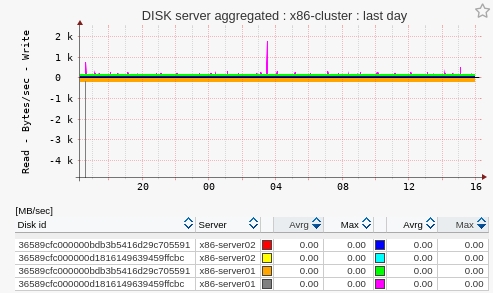
|
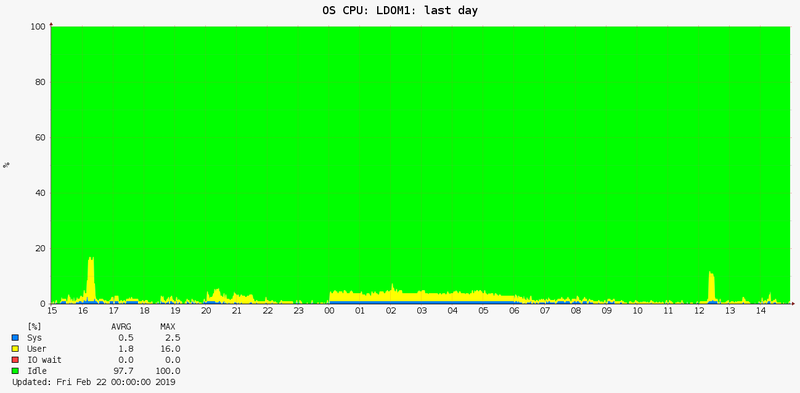
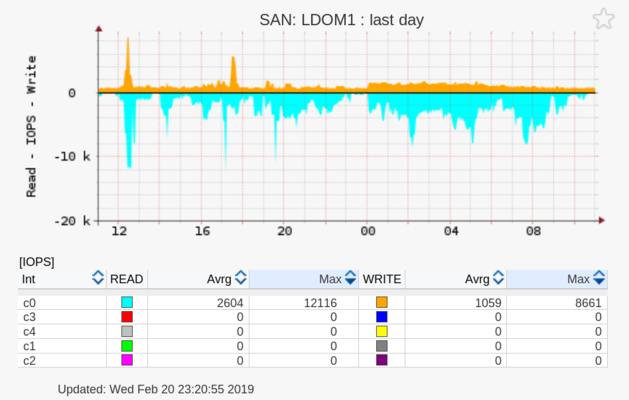
CDOM |
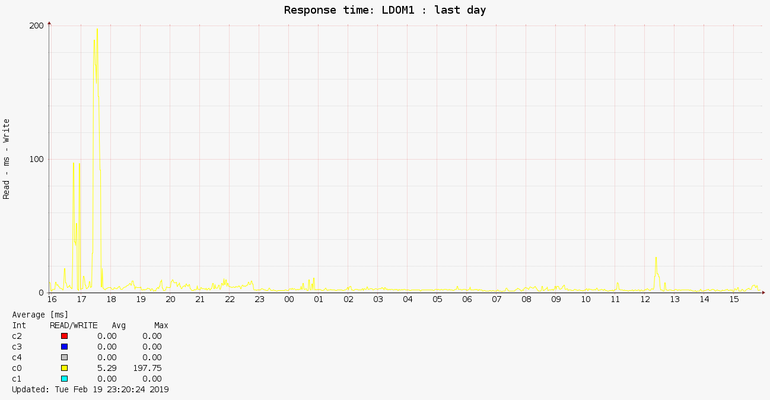
LDOM |
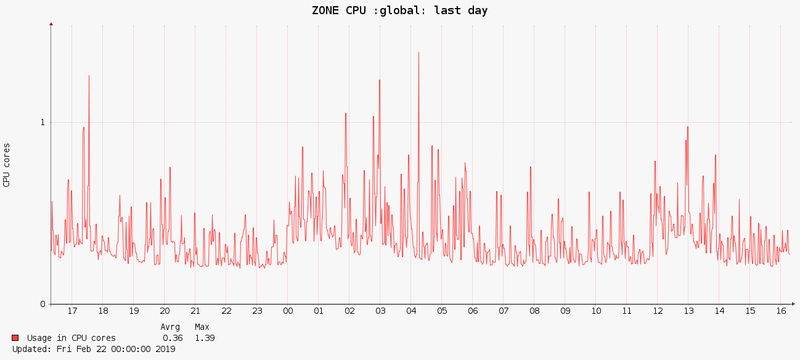
Global Zone |
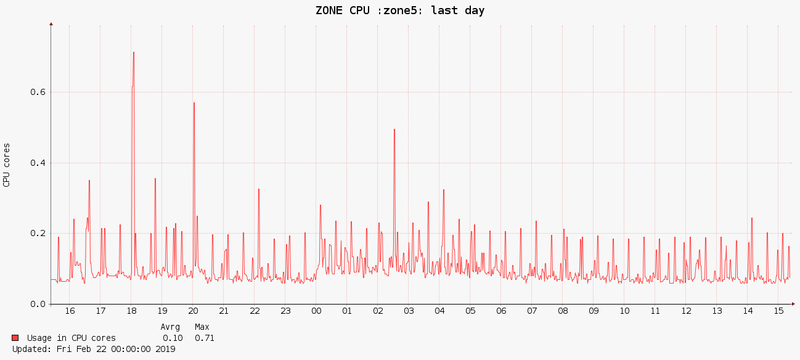
Zone |
|
|---|---|---|---|---|
| CPU | 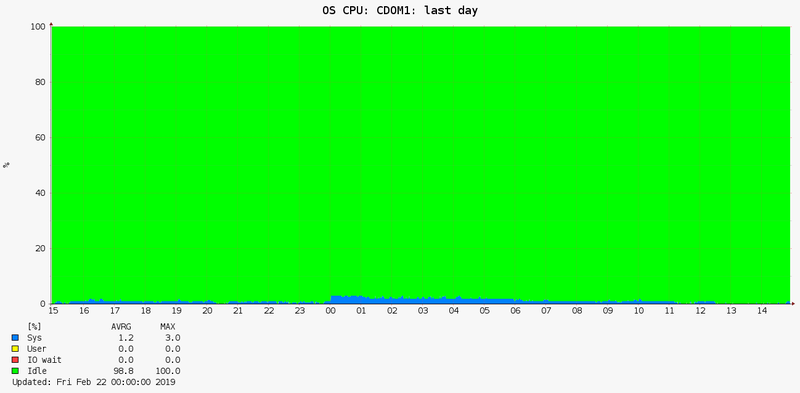 |
 |
 |
 |
| Memory |  |
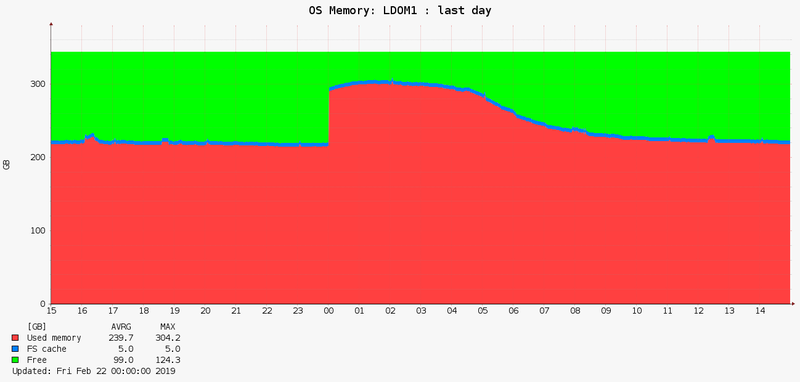 |
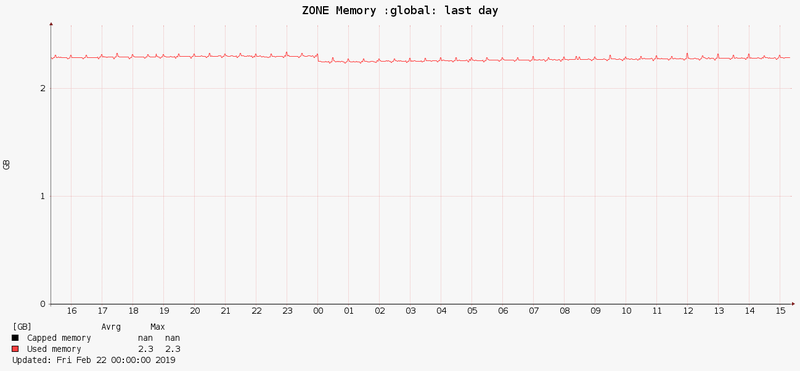 |
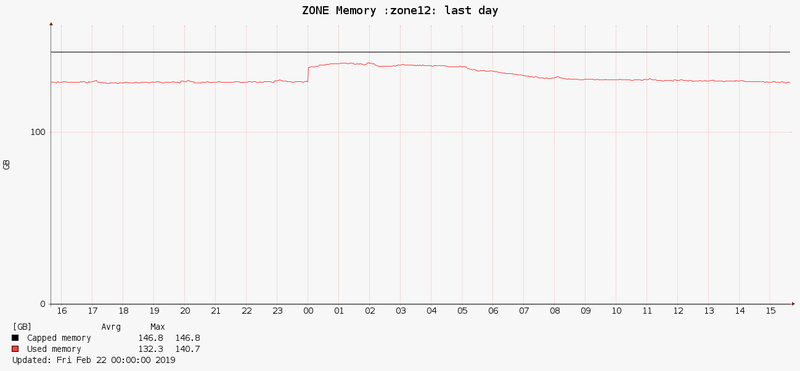 |
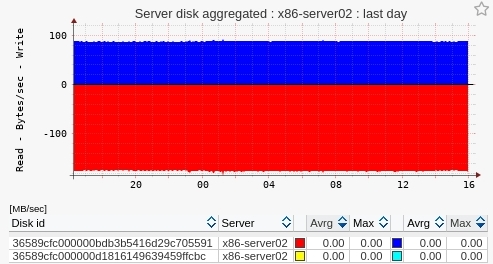
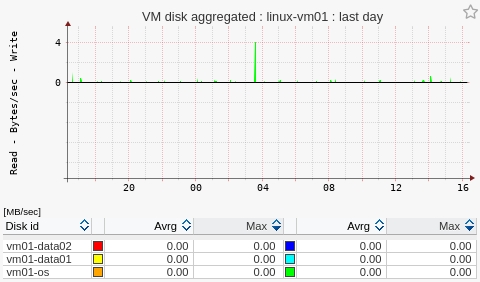
| Disk | 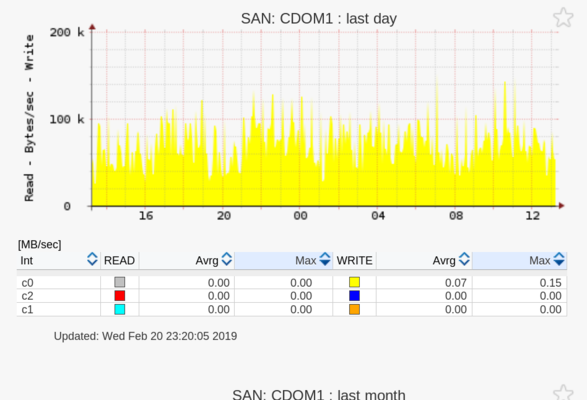 |
 |
||
| Disk IOPS | 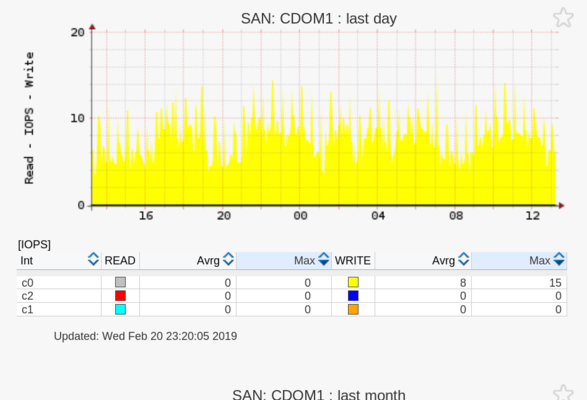 |
 |
||
| Disk Latency | 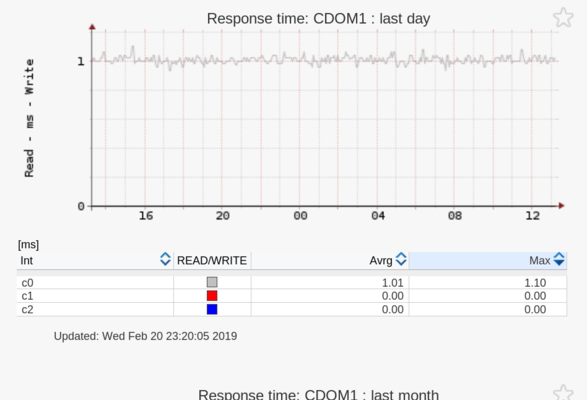 |
 |
||
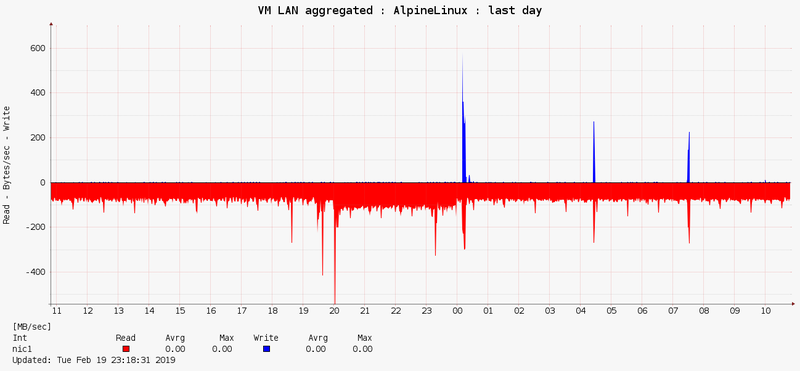
| Network | 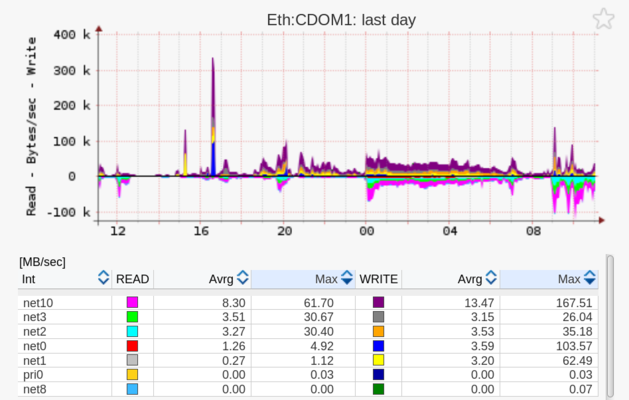 |
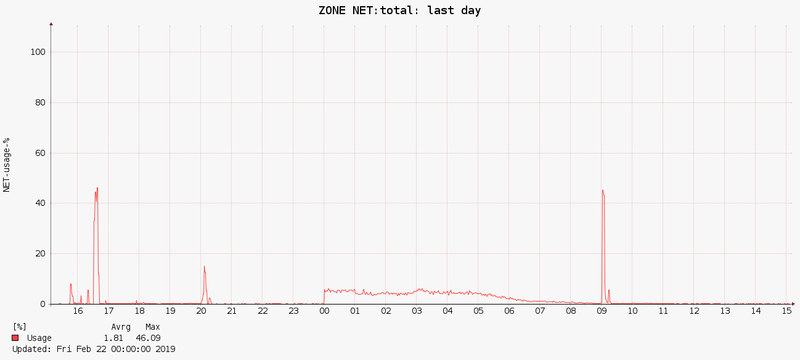 |
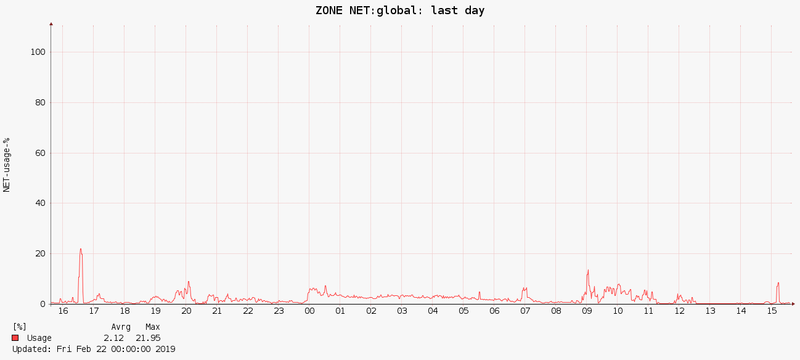 |
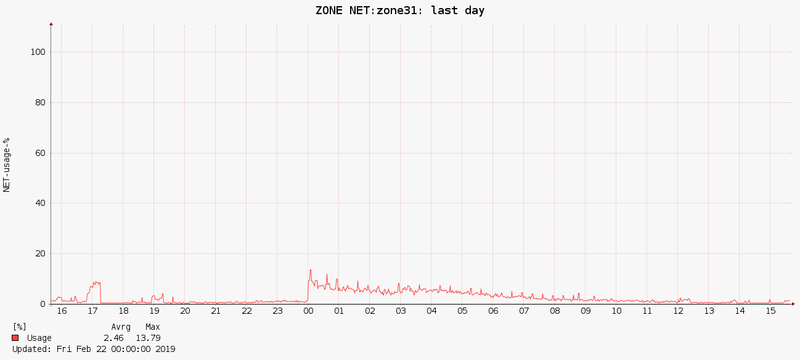 |
Monitored components
- CDOM
- LDOM
- Global Domain
- Zone
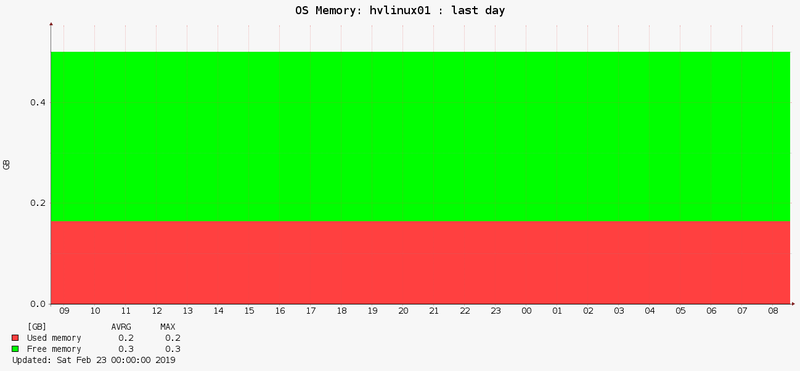
Monitored metrics
- CPU
- Memory utilization
- Paging
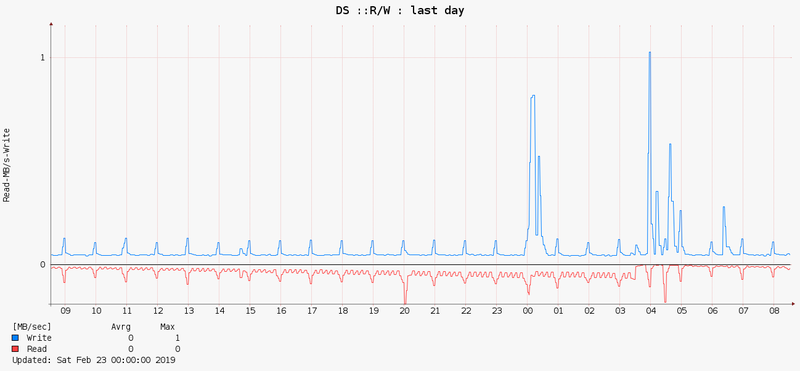
- LAN throughput MB/sec
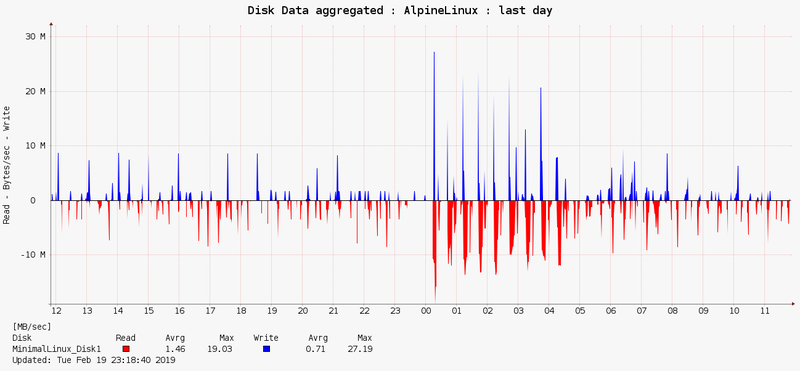
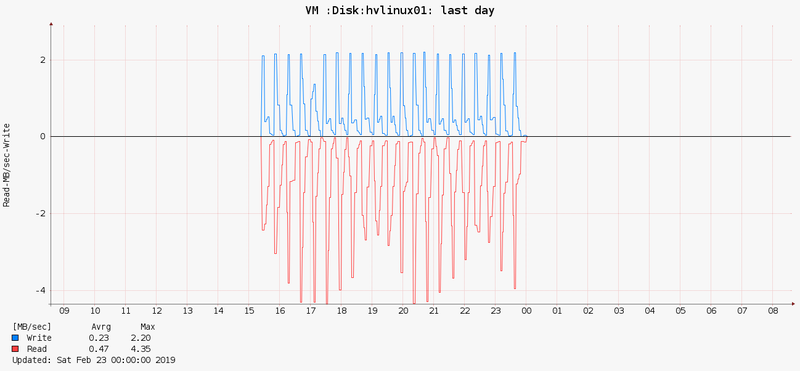
- Disk throughput MB/sec
- Disk throughput IOPS
- Disk latency
Collected data set can be enhanced about OS agent which brings these additional metrics:
| OS CPU | CPU sys, user, IO wait |
| CPU queue | Load avrg, Blocked processes |
| JOB | CPU, Memory |
| Memory utilization | Used, FS cache |
| LAN (ethernet adapters) | MB/sec, packet count |
| SAN (FC,vSCSI adapters) | MB/sec, packets/sec, Latency |
| Paging space utilization | Usage in % |
| Paging rate | MB/sec |
| Filesystem usage | Usage in %, GB |
| Memory Pools |
|
Cluster |
Hyper-V Node |
Win server |
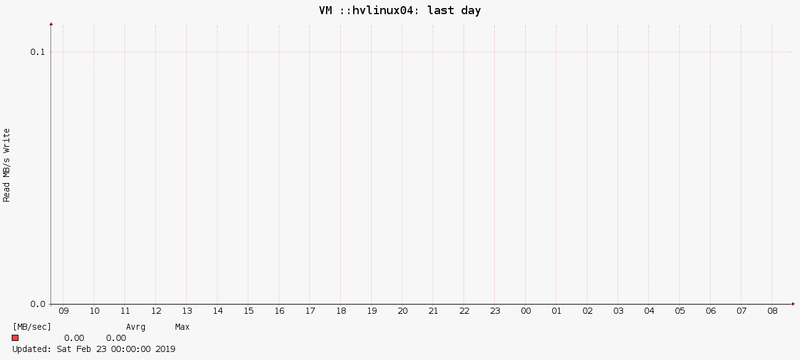
VM |
|
|---|---|---|---|---|
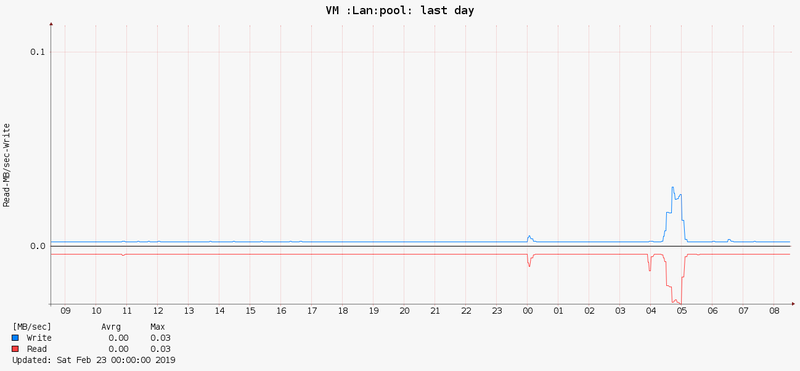
| CPU | 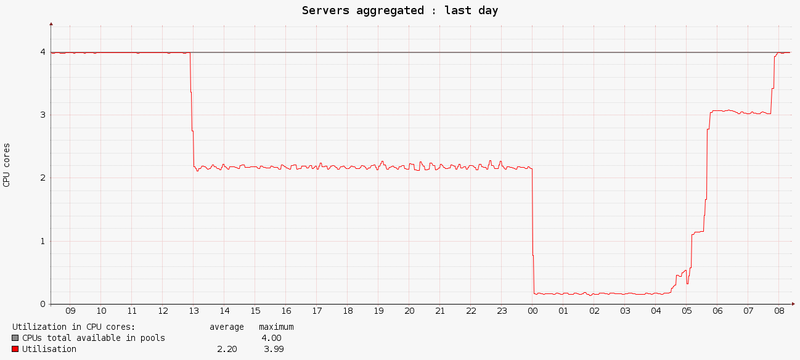 |
 |
 |
 |
| CPU aggregated | 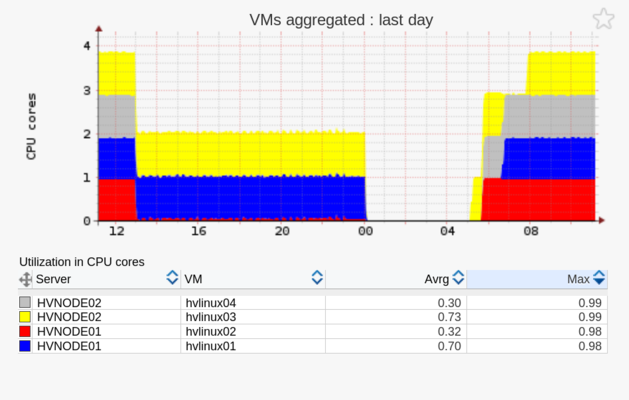 |
|||
| Memory | 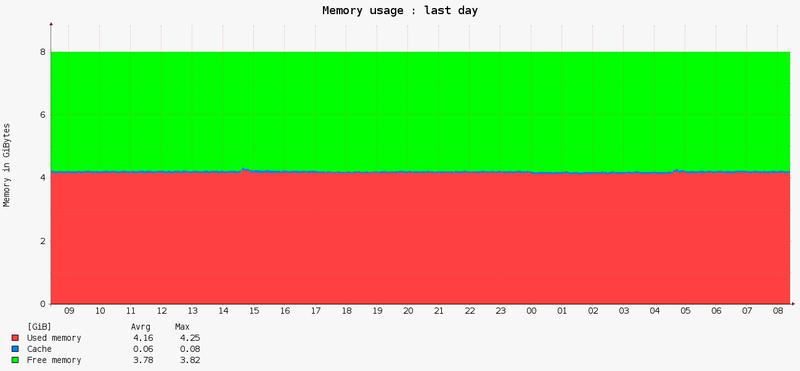 |
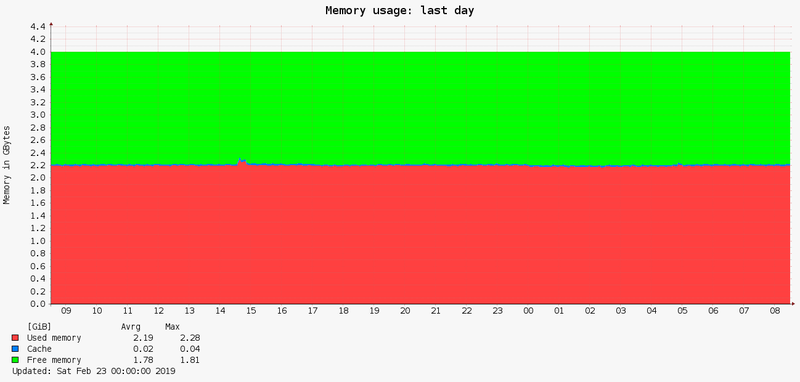 |
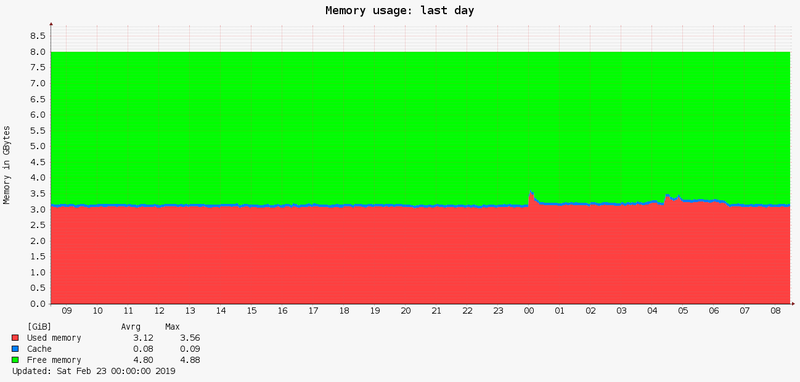 |
 |
| Disk usage | 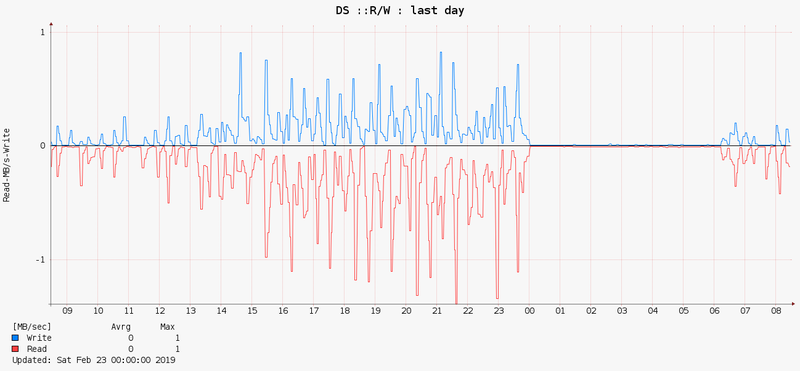 |
 |
 |
|
| Disk IOPS | 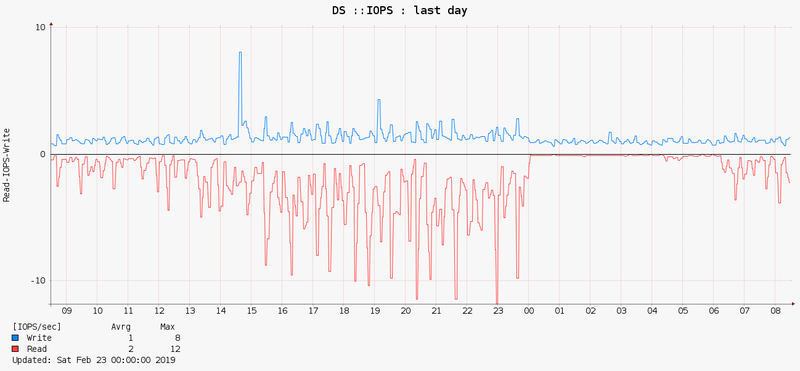 |
 |
||
| Disk Latency | 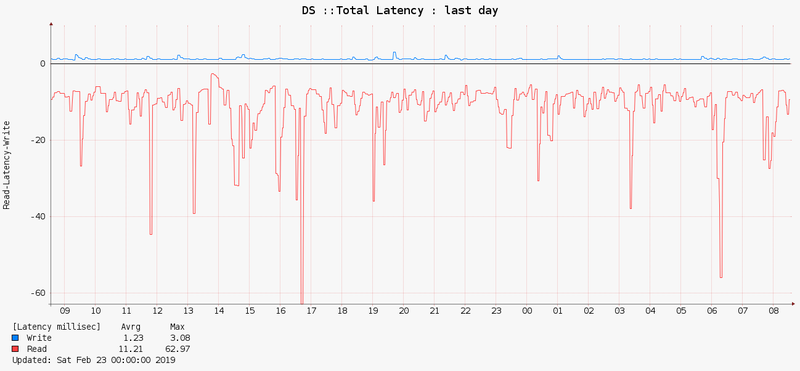 |
 |
||
| Disk Capacity | 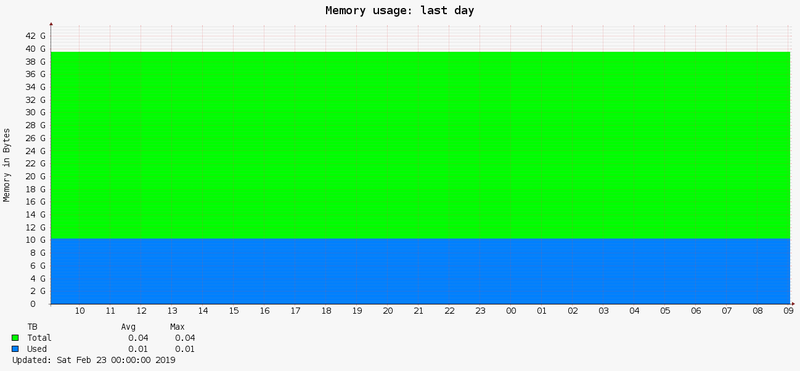 |
|
||
| Network | 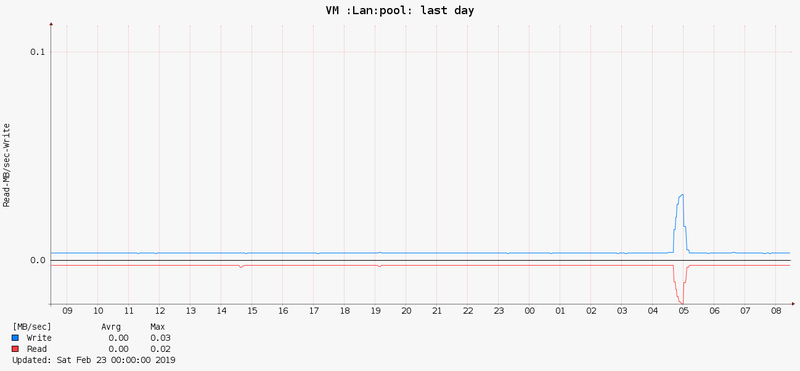 |
 |
 |
Monitored components
- MS Windows server
- Hyper-V Cluster
- Hyper-V Cluster node
- Hyper-V Disk
- Hyper-V Virtual Machine
Monitored metrics
- CPU
- Memory utilization
- Paging
- LAN throughput MB/sec
- Disk throughput MB/sec
- Disk throughput IOPS
- Disk latency
- Disk capacity