WRKACTJOB implementation in LPAR2RRD
The page contains description how work these 3 panels:- WRKACTJOB
- CPUTOP
- IOTOP
Our approach is not graphing all running processes on the operating system. We select only top 10 biggest CPU consumers in each sampling periods, obtain necessary performance metric for them and send this info to the LPAR2RRD server.
Data is captured every minute and it is sent to the LPAR2RRD server every 10th minute.
Each sampling period selects only 10 processes with the highest CPU utilization in this period.
You can see that graphs usually contain more than 10 processes Top 10 is changing, new processes start, some exit and running processes might vary in their CPU consumption (some can miss in top 10 for some time).
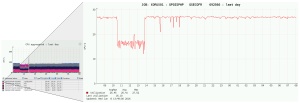
TIP: Click on a color square of each process to get CPU utilization of this single process in a bigger pop-up graph.
WRKACTJOB
It uses percent metric which you could see in default WRKACTJOB screen.100% here is equal to CPU entitlement value of each LPAR.
It can go above 100% if number of configured logical processors is higher than CPU entitled value what is quite common setup.
CPUTOP
This is different view of above selected processes.Shows consumed CPU time of these processes converted in CPU cores.
Advantage is when the process is not selected via to top10 for some time and still using some CPU cycles then once it appears in top10 then we know its usage during not selected period and can graph it as average during that period.
It should show similar picture as WRKACTJOB only in CPU core metric.
IOTOP
This is IO/sec of above selected processes (TOP10 in CPU usage).It is more informative as could happen that the biggest IO consumers are not the biggest CPU consumers.
Then you do not have to see them here if they do not appear in CPU top 10 processes.
Further examples can be found on this page and in our demo
Graphing of individual jobs
Mouse click on the color square before the each job name.Then appears a pop-up graph with selected job only.
Avrg vrs AvrgRun
- Avrg: average from whole time period (day/week) even from times when there is no data in graph of a process
- AvrgRun: average from time period when the tool has data for that process (note only top10 processes are monitored at the time, might happen that it does not appear in top10 and then no data is collected)


