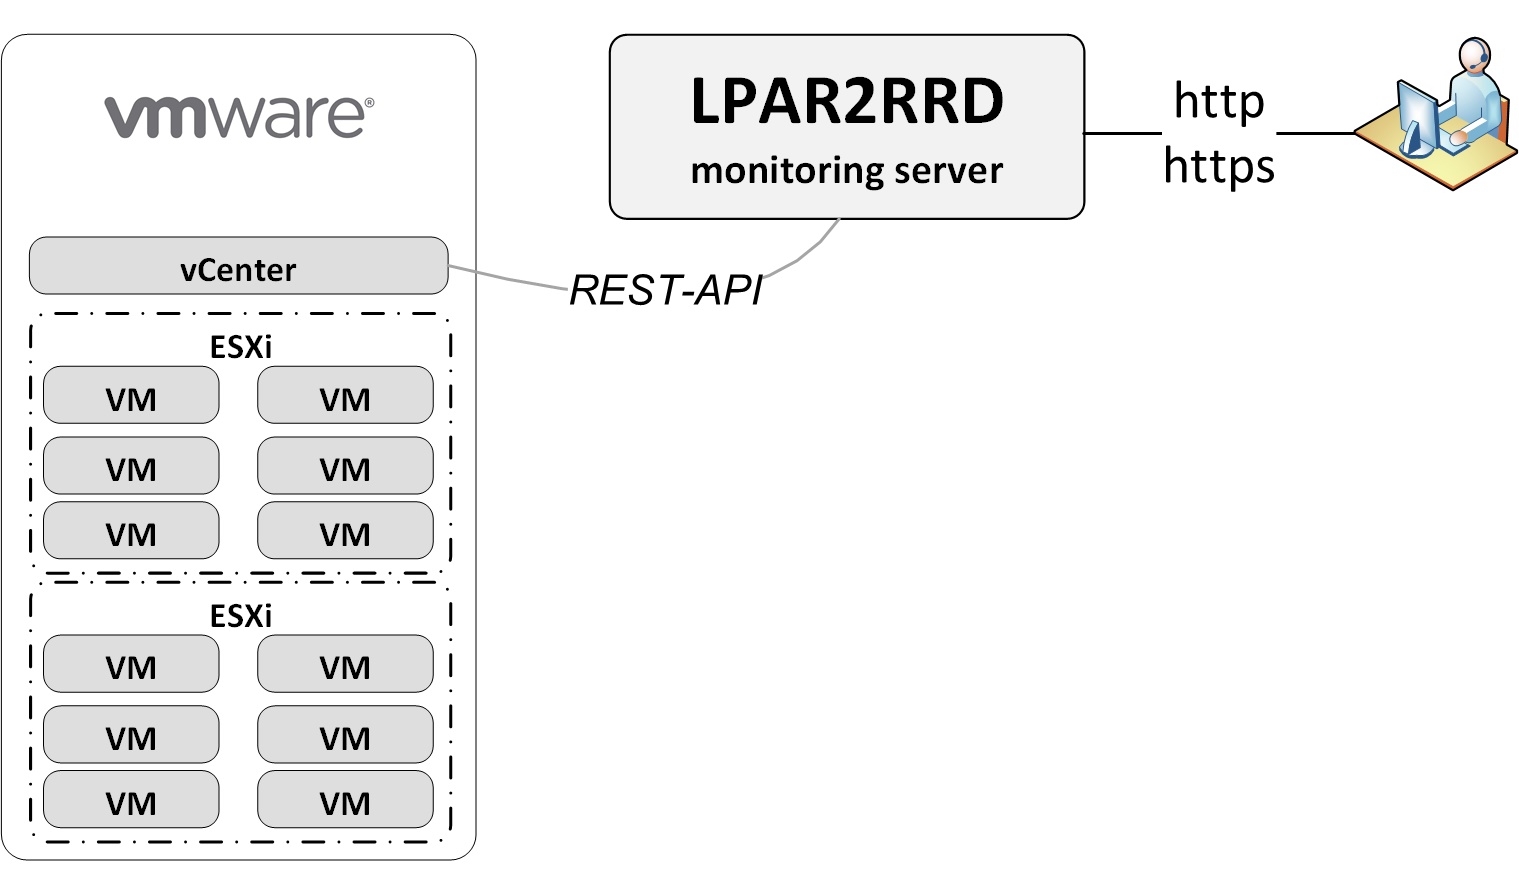
VMware Monitoring
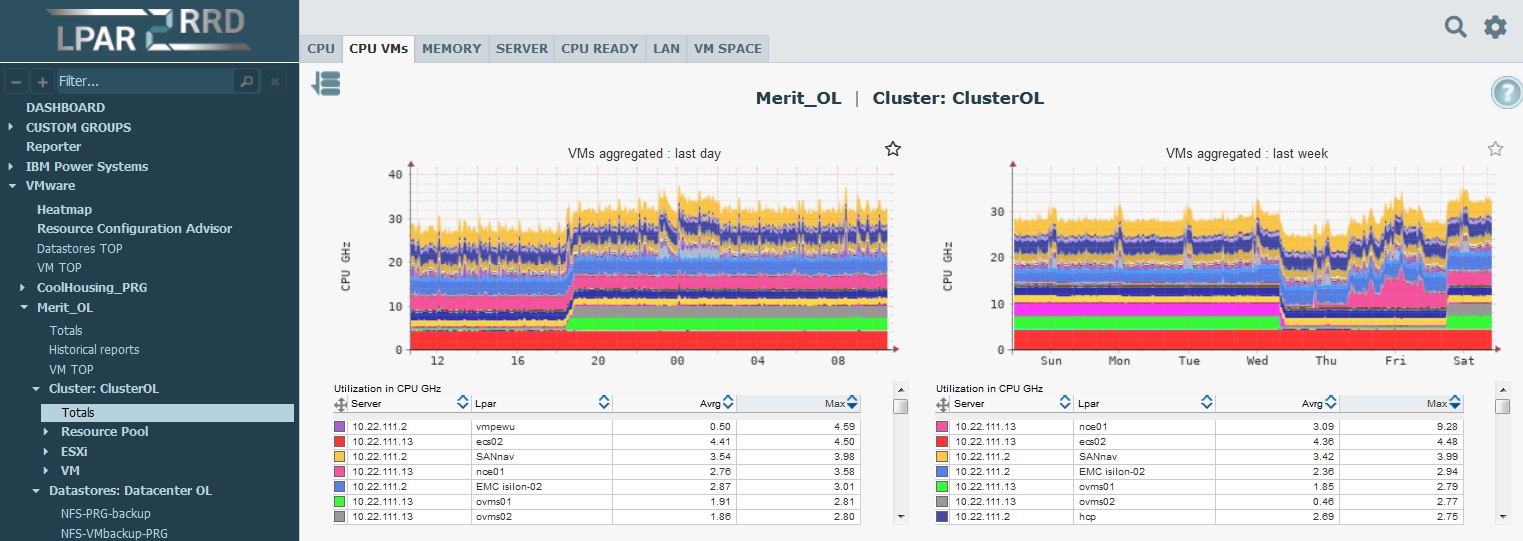
Tool is agent-less. All required data is downloaded from the vCenter via VMware Perl SDK.
It is free!
You can see all features on our demo site.
Monitoring Resources
- vCenter
- Cluster
- Resource Pool
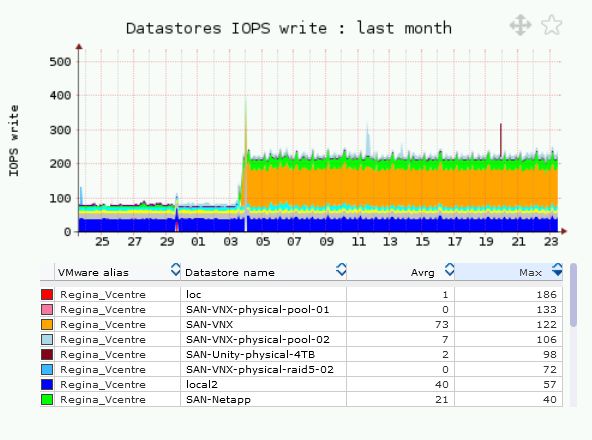
- Datastore
- ESXi
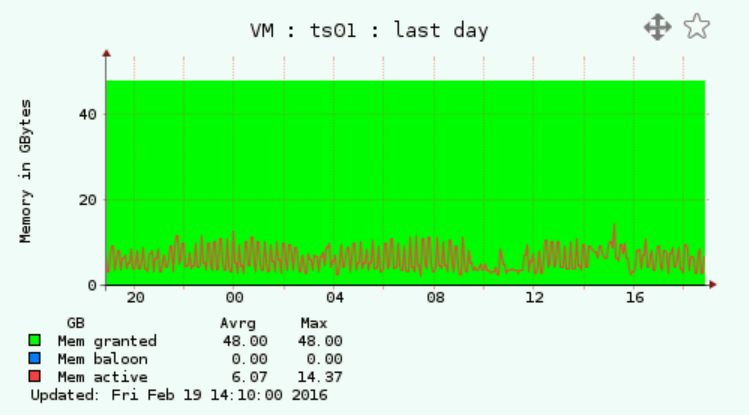
- Virtual Machine (VM)
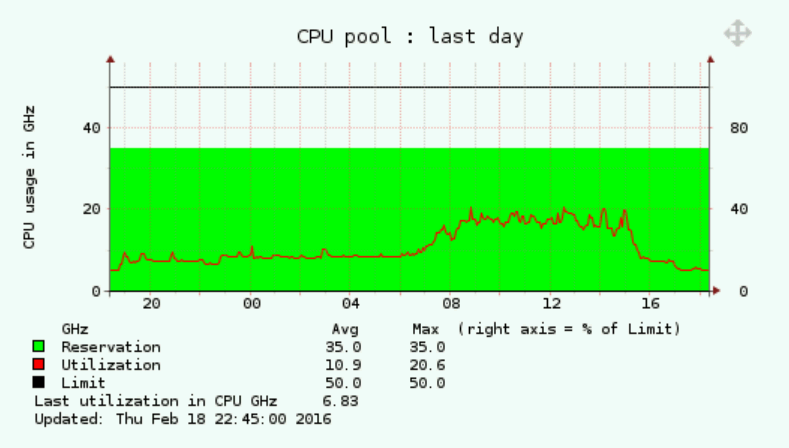
Monitoring Metrics
- CPU performance (GHz, CPU cores, CPU Ready)
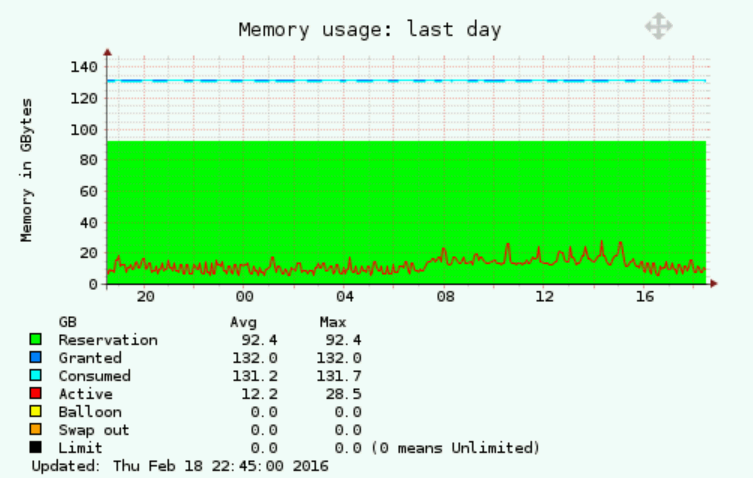
- Memory usage (reserved, granted, consumed, active, baloon, swap in, limit)
- LAN performance in (MB/sec)
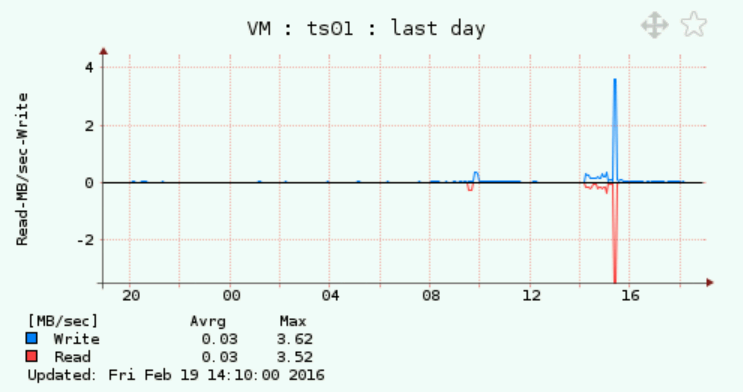
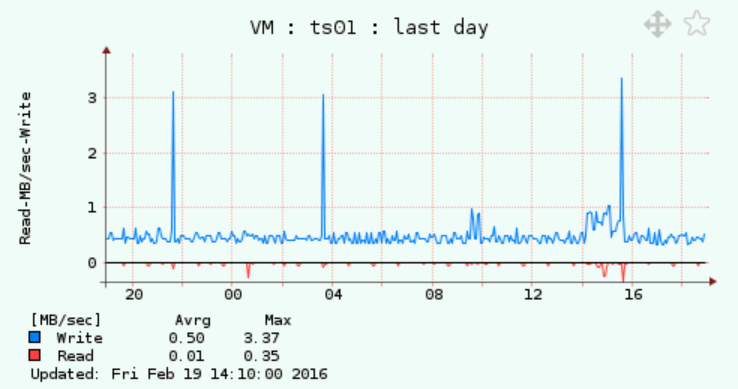
- Disk performance (MB/sec, IO per sec, latency in ms)
- Disk usage (GB)
Other Monitoring Features
- vMotion graphical tracking
- Trends
- Historical reports
- Custom Groups: grouping in one graph utilization from many virtual machines regardless where they run
- Heatmap
Monitoring Matrix
| vCenter | Cluster | Resource Pool | ESXi | VM | Datastore | |
|---|---|---|---|---|---|---|
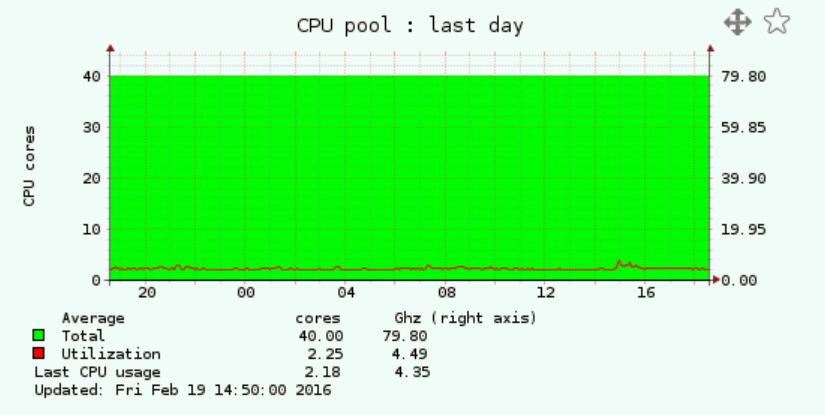
| CPU total | 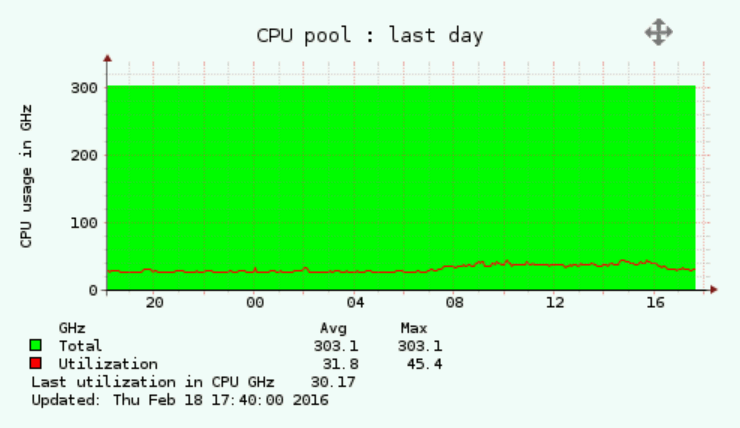 |
 |
 |
 |
||
| CPU cluster aggregated | 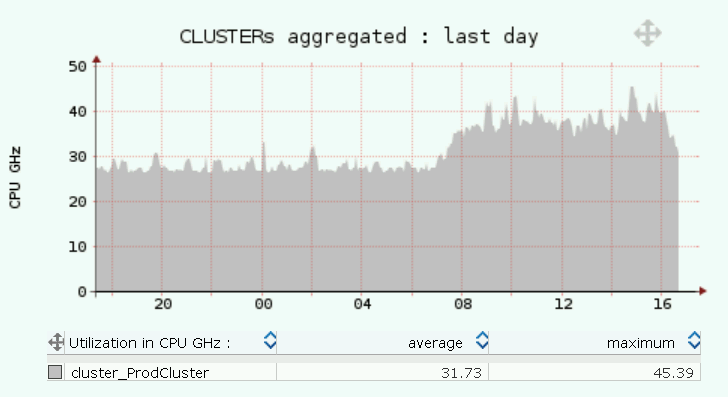 |
|||||
| CPU ESXi aggregated | 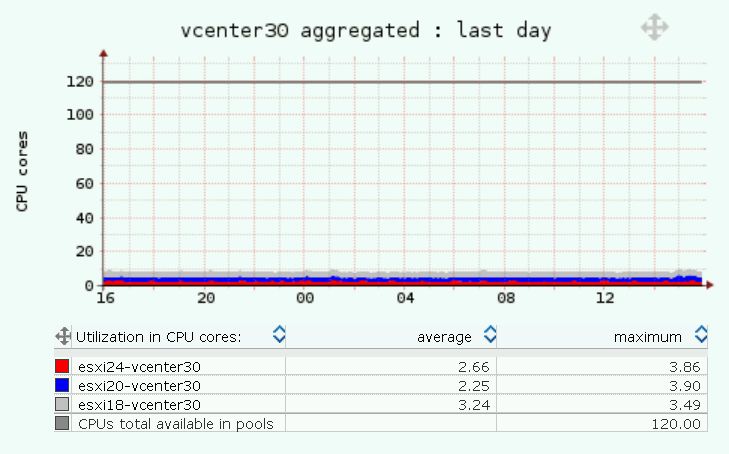 |
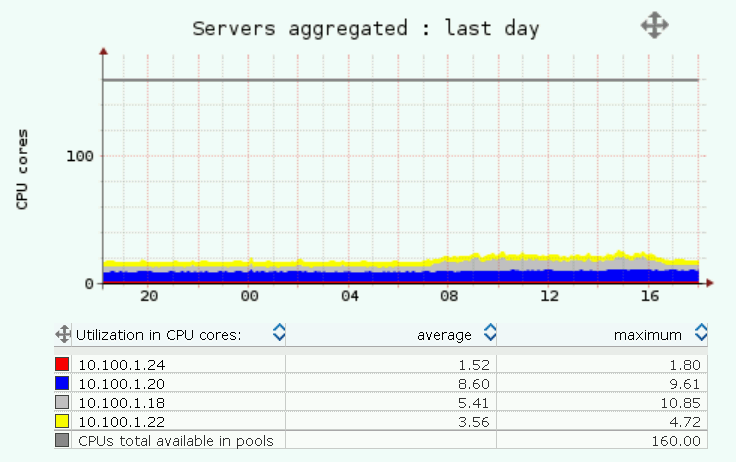 |
||||
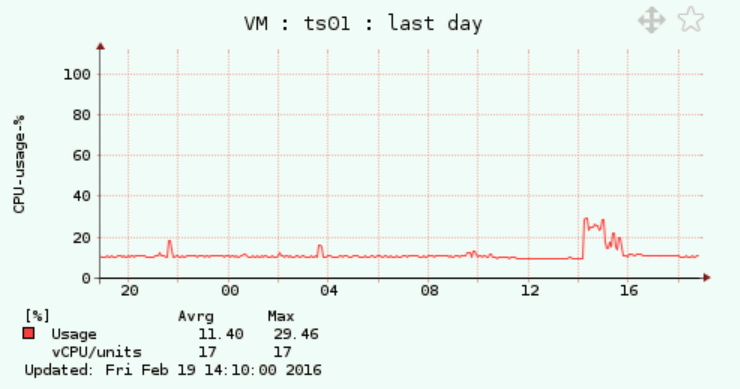
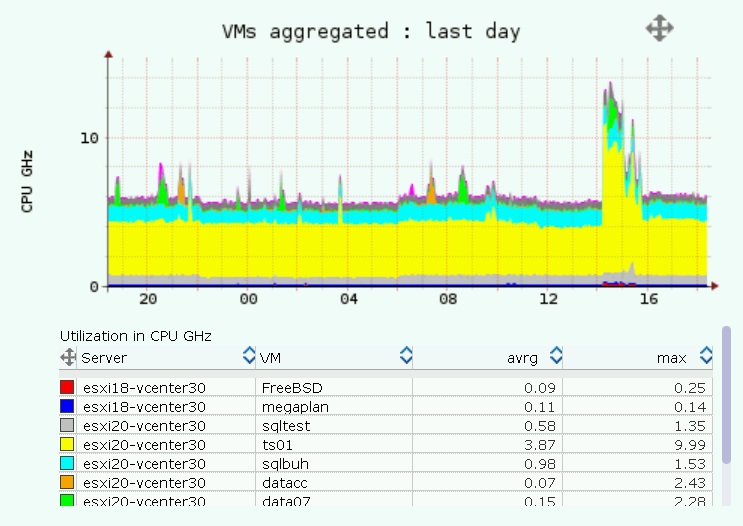
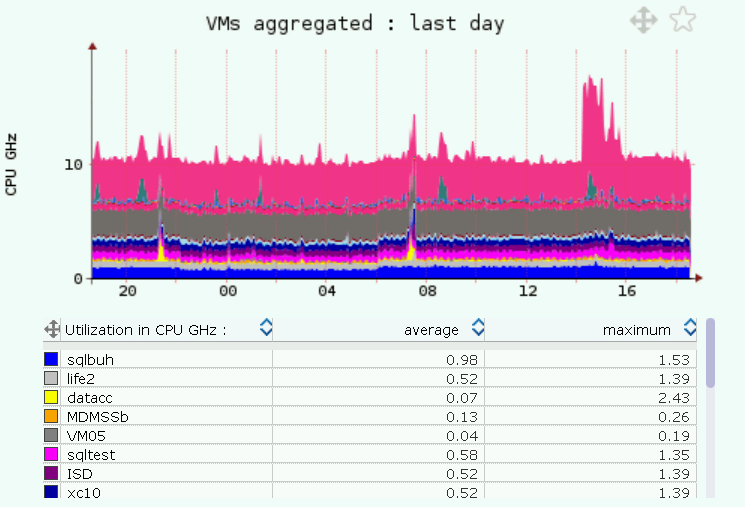
| CPU VM aggregated | 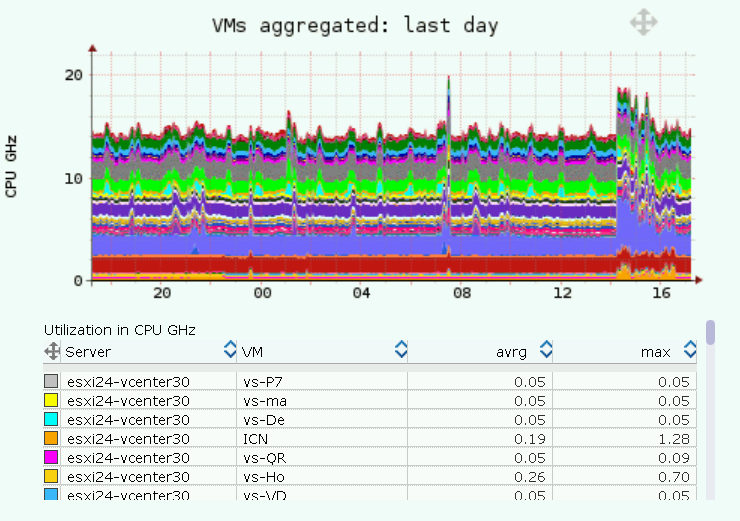 |
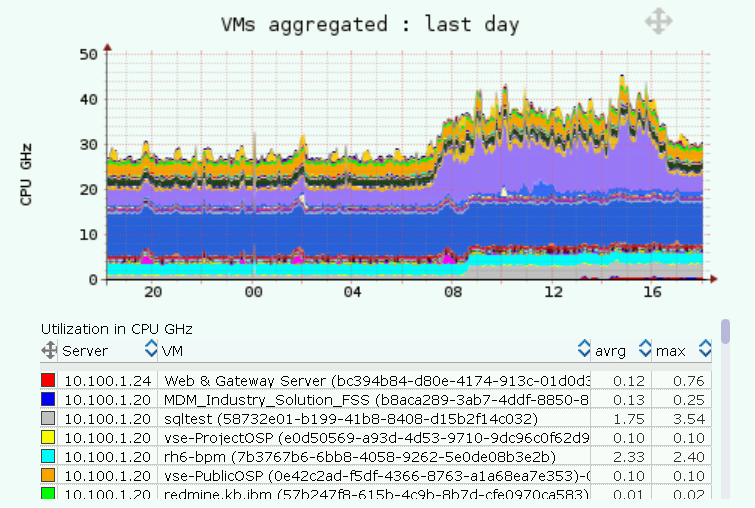 |
 |
 |
||
| CPU ready | 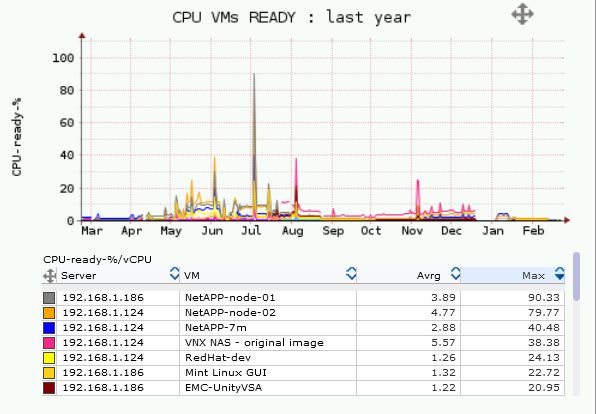 |
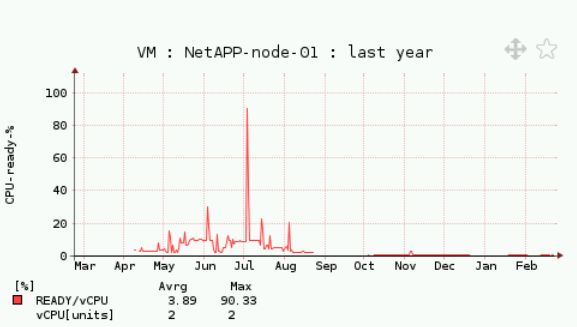 |
||||
| Memory total | 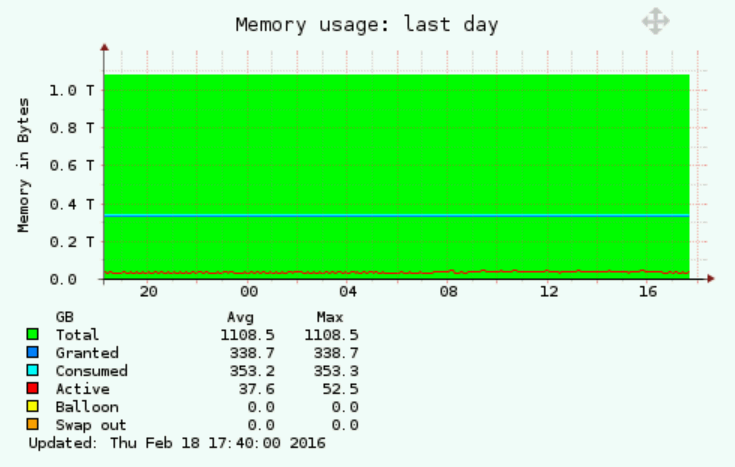 |
 |
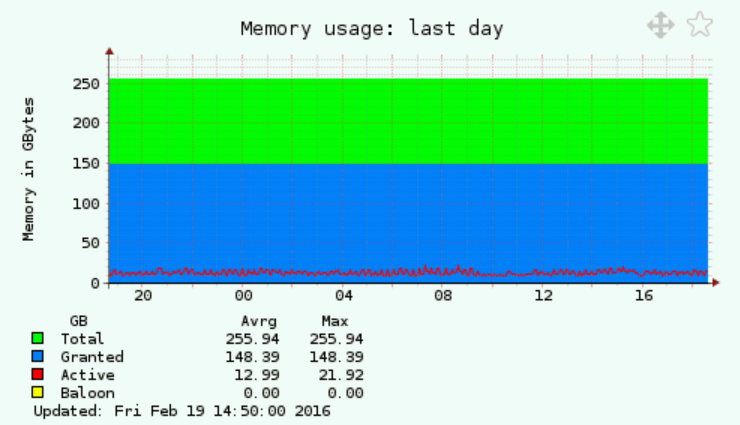 |
 |
||
| Memory VM aggregated | 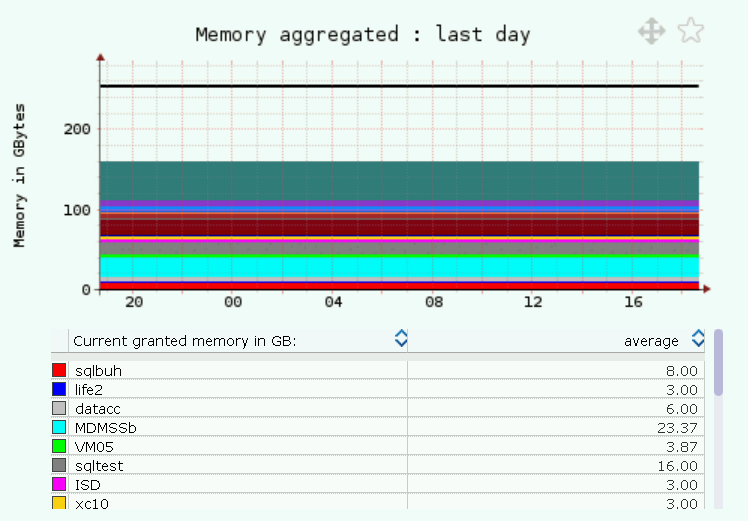 |
|||||
| Network | 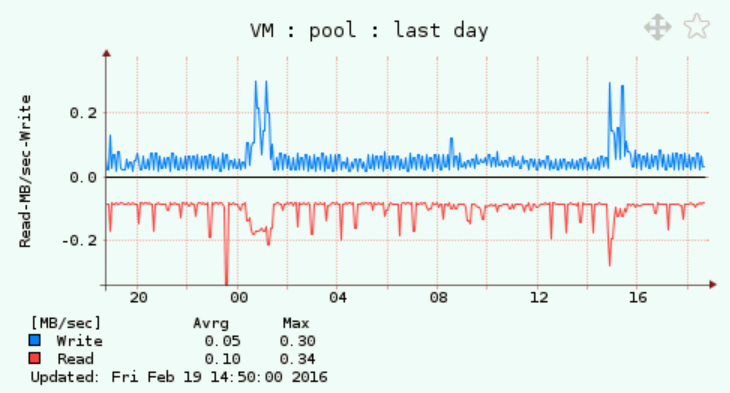 |
 |
||||
| Storage performance | 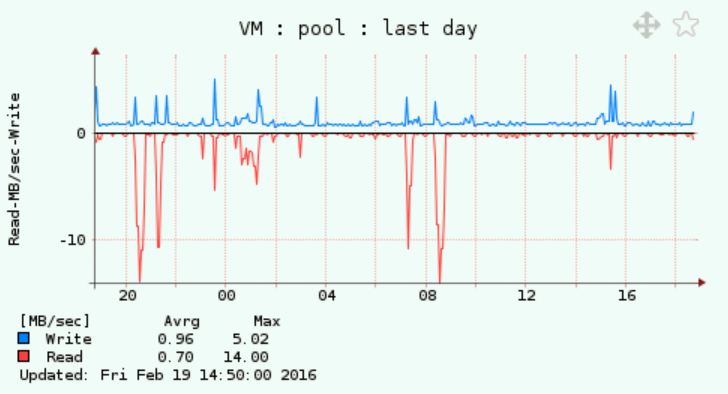 |
 |
 |
|||
| Storage allocation | 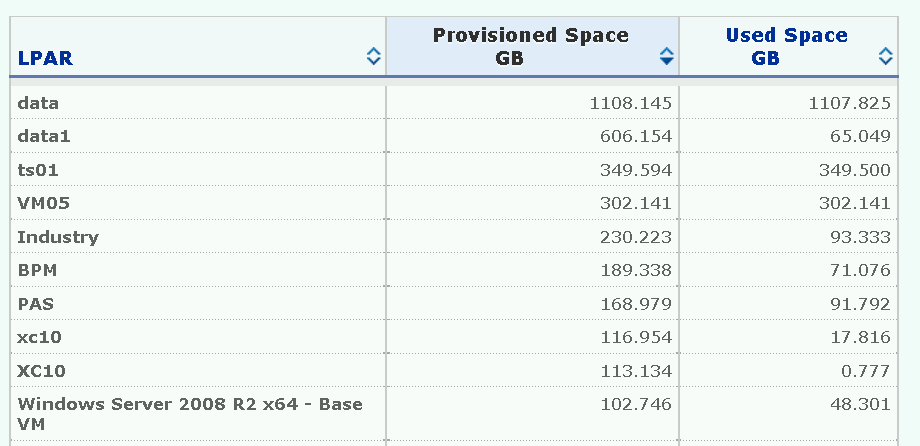 |
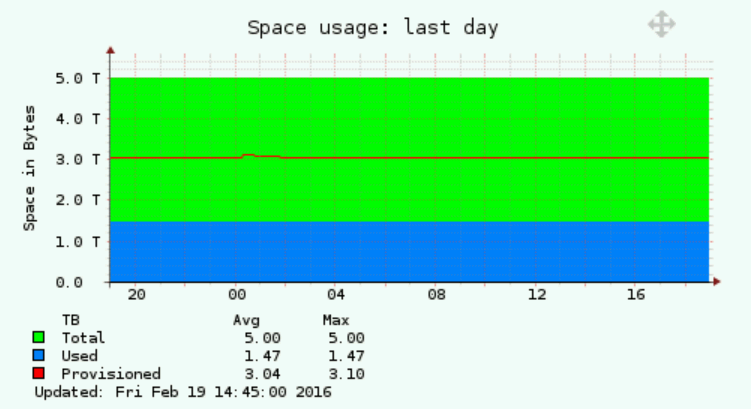 |
||||
| Power supply | 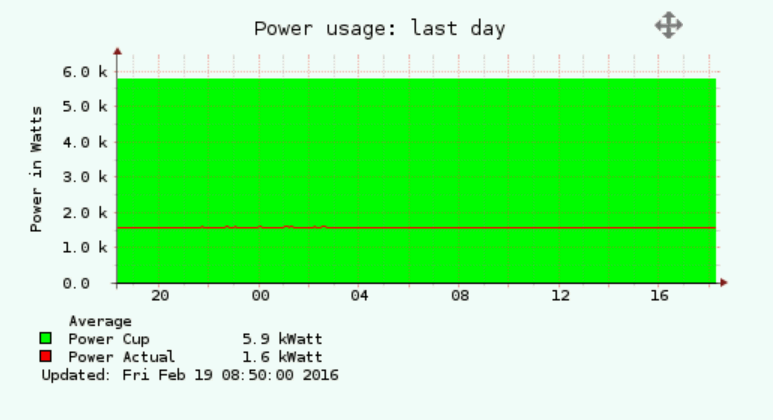 |
|||||
| vMotion | 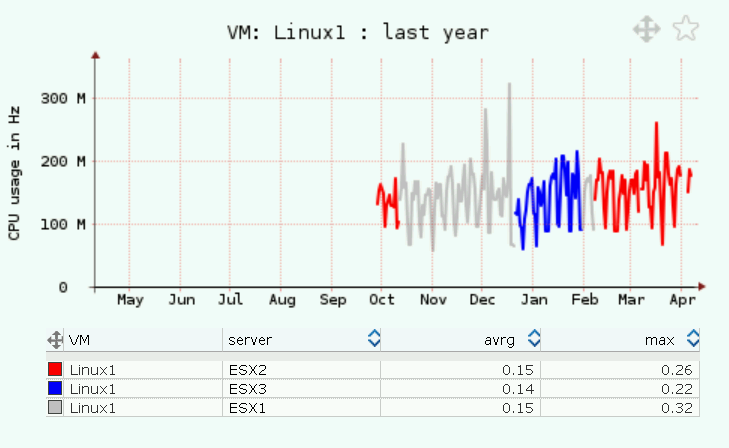 |
OS Agent
Collected data set can be enhanced about OS agent which brings these additional monitoring metrics:| OS CPU | CPU sys, user, IO wait |
| CPU queue | Load avrg, Blocked processes |
| JOB | CPU, Memory |
| Memory utilization | Used, FS cache |
| LAN (ethernet adapters) | MB/sec, packet count |
| SAN (FC,vSCSI adapters) | MB/sec, packets/sec, Latency |
| Paging space utilization | Usage in % |
| Paging rate | MB/sec |
| Filesystem usage | Usage in %, GB |