Data averaging and peaks
This article should shed some lights on data averaging in the graphs.Averaging is how RRDTool (used by LPAR2RRD for data store and presentation) and other tools are working. You cannot show all short peaks if you do not have enough available pixels on the graph. Only the way how to display data is averaging data.
When you have 1 minute samples then you need 24h * 60m = 1440 pixels width to see all details include short 1 minute peaks without averaging.
However our default graph width is 400 pixels. That is why data must be averaged and some short peaks do not have to be visible. Long peaks are not affected.
There is no solution to avoid that. Only what can help is increase of the graph width.
There are 3 ways how to do it:
- Pop-up graph: by a click on the each graph it appears in the new big pop-up window.
- Graph zooming feature
- Historical reports and possibility to set in the form X and Y axis width in pixels
Further limitation for showing peaks in historical data might be data retention.
Older data is being averaged to keep fixed size of database files so short peaks can disappear from data completely after some time.
Users under support can ask for adjusting of data retention policy to whatever they wish.
MAX graphing
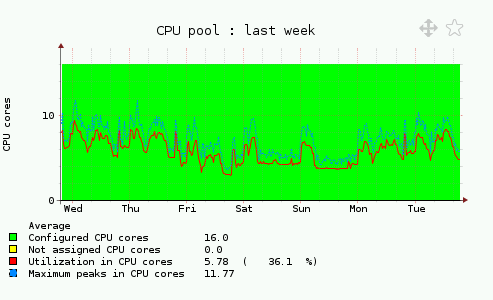
CPU max pool graphs for IBm Power Systems. It saves MAX for each interval and graph it together with usual averaged CPU utilization. On the example you can see dotted blue line which represents MAX achieved in given period.Why yearly graph shows less MAX value than the others?
Yearly graph should always show the highes MAX. It is true however it might not have to happen in every case.You can see sometimes lower MAX value in yearly graphs than in the others. However when you use zoom in the yearly graph then it is ok, and you can see the highest MAX.
It is all about data averaging which must happen even here. Yearly graph is based on 5 hours data (max in this case) but the picture itself has only 400 pixels width. Then RRDTool must average some 5 hours data to fit into that width what might cause small changes in peak high.
