HMC monitoring
You can monitoring HMC itself if you use HMC CLI (ssh) access connection.Note that it needs ssh access and does not work if you have enabled only HMC REST API access.
Following data is collected and graphed from all connected HMCs:
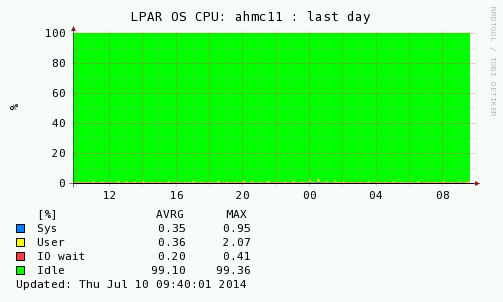
- OS CPU utilization of user/sys/IO wait/idle in %
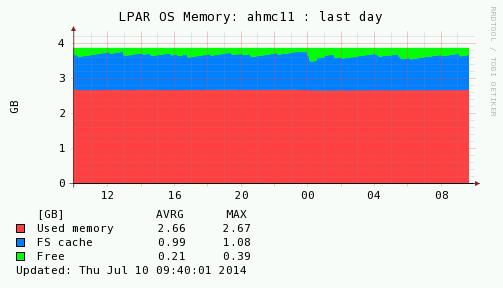
- Memory utilization of used/fs cache/free memory in MB
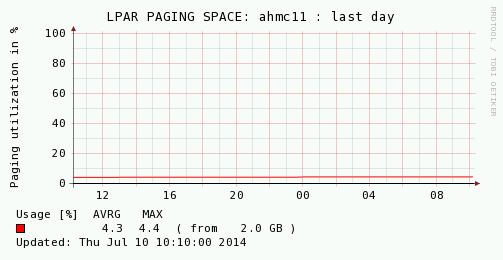
- Paging rate in MB/sec
Installation
-
You have to install the OS agent on the LPAR2RRD server.
Agent download (lpar2rrd-agent-7.XX-0.noarch.rpm for Linux for example) and install it under root:rpm -Uvh lpar2rrd-agent-7.XX-0.noarch.rpm
-
Schedulle HMC data load from crontab:
0,5,10,15,20,25,30,35,40,45,50,55 * * * * . /home/lpar2rrd/lpar2rrd/etc/lpar2rrd.cfg; /usr/bin/perl /opt/lpar2rrd-agent/lpar2rrd-agent.pl -c localhost > /var/tmp/lpar2rrd-agent-hmc.out 2>&1
Examples
Typical CPU/Mem/Paging usage on a HMC managing 4 x POWER7 servers with 100 LPARS:

|

|

|